Fig. 2
Download original image
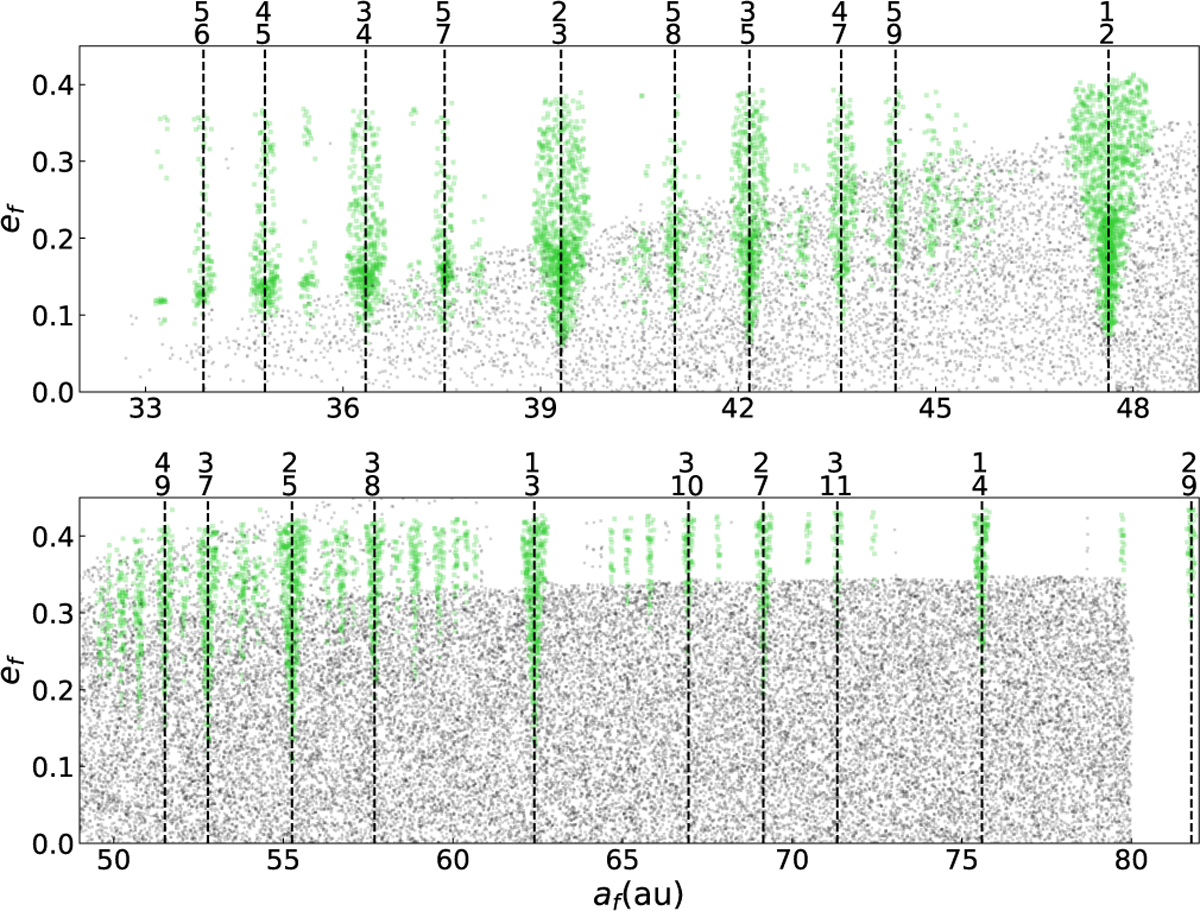
Distribution of final semimajor axis, af, and final eccentricity, ef, from simulations with ȧN = 0.2 au/Myr. Green points represent objects identified as being in MMRs, while the gray points indicate the others. The positions of some major MMRs are marked with dashed lines, with the corresponding p (upper number) and q (lower number) values indicated above the lines. For clarity, the figure is divided into two panels using 49 au as the boundary, showing the inner and outer regions separately.
Current usage metrics show cumulative count of Article Views (full-text article views including HTML views, PDF and ePub downloads, according to the available data) and Abstracts Views on Vision4Press platform.
Data correspond to usage on the plateform after 2015. The current usage metrics is available 48-96 hours after online publication and is updated daily on week days.
Initial download of the metrics may take a while.