Fig. 4
Download original image
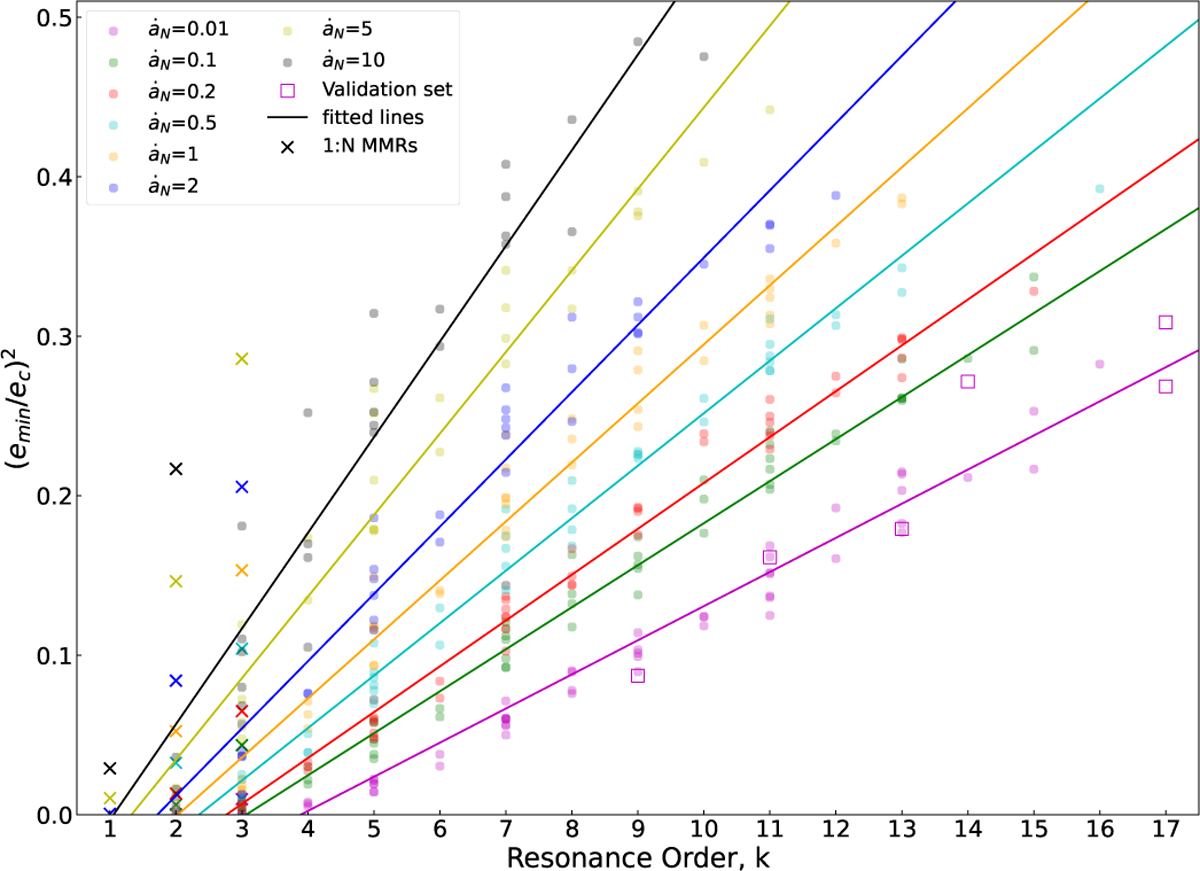
Relationship between ![]() and the resonance order k under different migration rates ȧN. The horizontal axis represents k, and the vertical axis represents the value of
and the resonance order k under different migration rates ȧN. The horizontal axis represents k, and the vertical axis represents the value of ![]() . Different colors indicate different ȧN, and the lines represent the fitting results based on Eqs. (1) and (2) for the corresponding ȧN. Cross marks denote the 1: q MMRs. The purple squares represent the validation set for the fit, and these MMRs were recorded with more than ten particles only when ȧN = 0.01 au/Myr.
. Different colors indicate different ȧN, and the lines represent the fitting results based on Eqs. (1) and (2) for the corresponding ȧN. Cross marks denote the 1: q MMRs. The purple squares represent the validation set for the fit, and these MMRs were recorded with more than ten particles only when ȧN = 0.01 au/Myr.
Current usage metrics show cumulative count of Article Views (full-text article views including HTML views, PDF and ePub downloads, according to the available data) and Abstracts Views on Vision4Press platform.
Data correspond to usage on the plateform after 2015. The current usage metrics is available 48-96 hours after online publication and is updated daily on week days.
Initial download of the metrics may take a while.