Fig. 6
Download original image
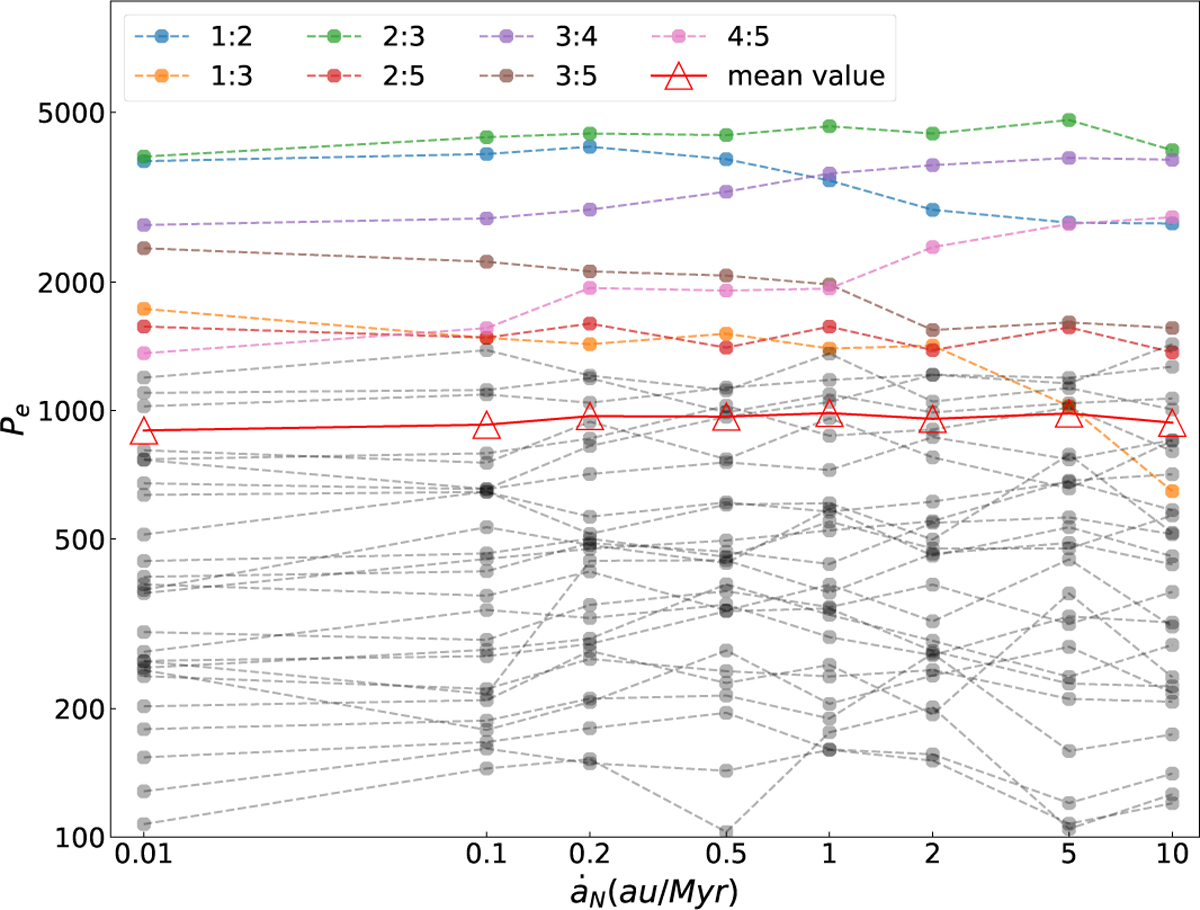
Variation in the capture efficiency of MMRs under different ȧN. The horizontal axis represents the migration rate, ȧN, and the vertical axis represents the capture number per unit eccentricity, Pe, both on logarithmic scales. The seven MMRs with the strongest capture capability are denoted by colored lines, while the others are shown in gray. The average result across all MMRs is represented by the solid red line with triangular markers.
Current usage metrics show cumulative count of Article Views (full-text article views including HTML views, PDF and ePub downloads, according to the available data) and Abstracts Views on Vision4Press platform.
Data correspond to usage on the plateform after 2015. The current usage metrics is available 48-96 hours after online publication and is updated daily on week days.
Initial download of the metrics may take a while.