Fig. 8
Download original image
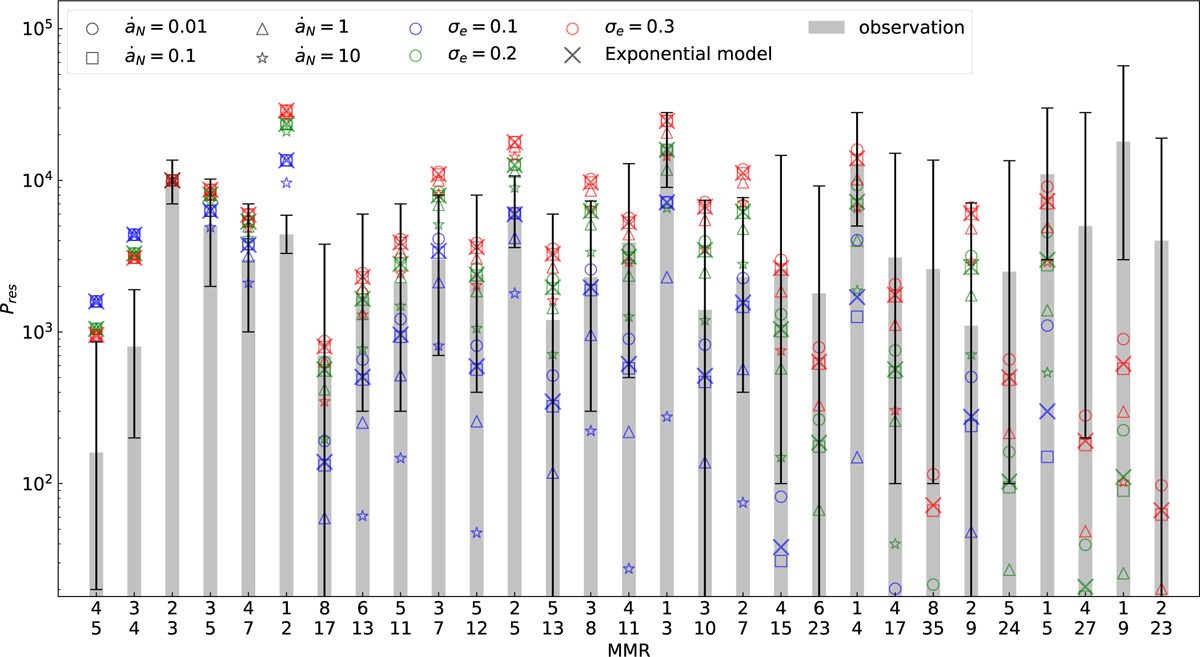
Captured population for each MMR under different parameters, compared with observations. The histogram displays the current observational results, with error bars indicating observational uncertainties (details in Table 1). Different markers denote different migration rates, while the crosses specifically denote the exponential migration model with an average migration rate of 0.1 au/Myr. Different colors represent different eccentricity excitations for the small bodies. The x-axis provides the corresponding p (above) and q (below) values for each MMR, arranged at equal intervals in order of proximity. The y-axis represents the population within each MMR, all data are normalized, with the 2:3 MMR as a reference standard.
Current usage metrics show cumulative count of Article Views (full-text article views including HTML views, PDF and ePub downloads, according to the available data) and Abstracts Views on Vision4Press platform.
Data correspond to usage on the plateform after 2015. The current usage metrics is available 48-96 hours after online publication and is updated daily on week days.
Initial download of the metrics may take a while.