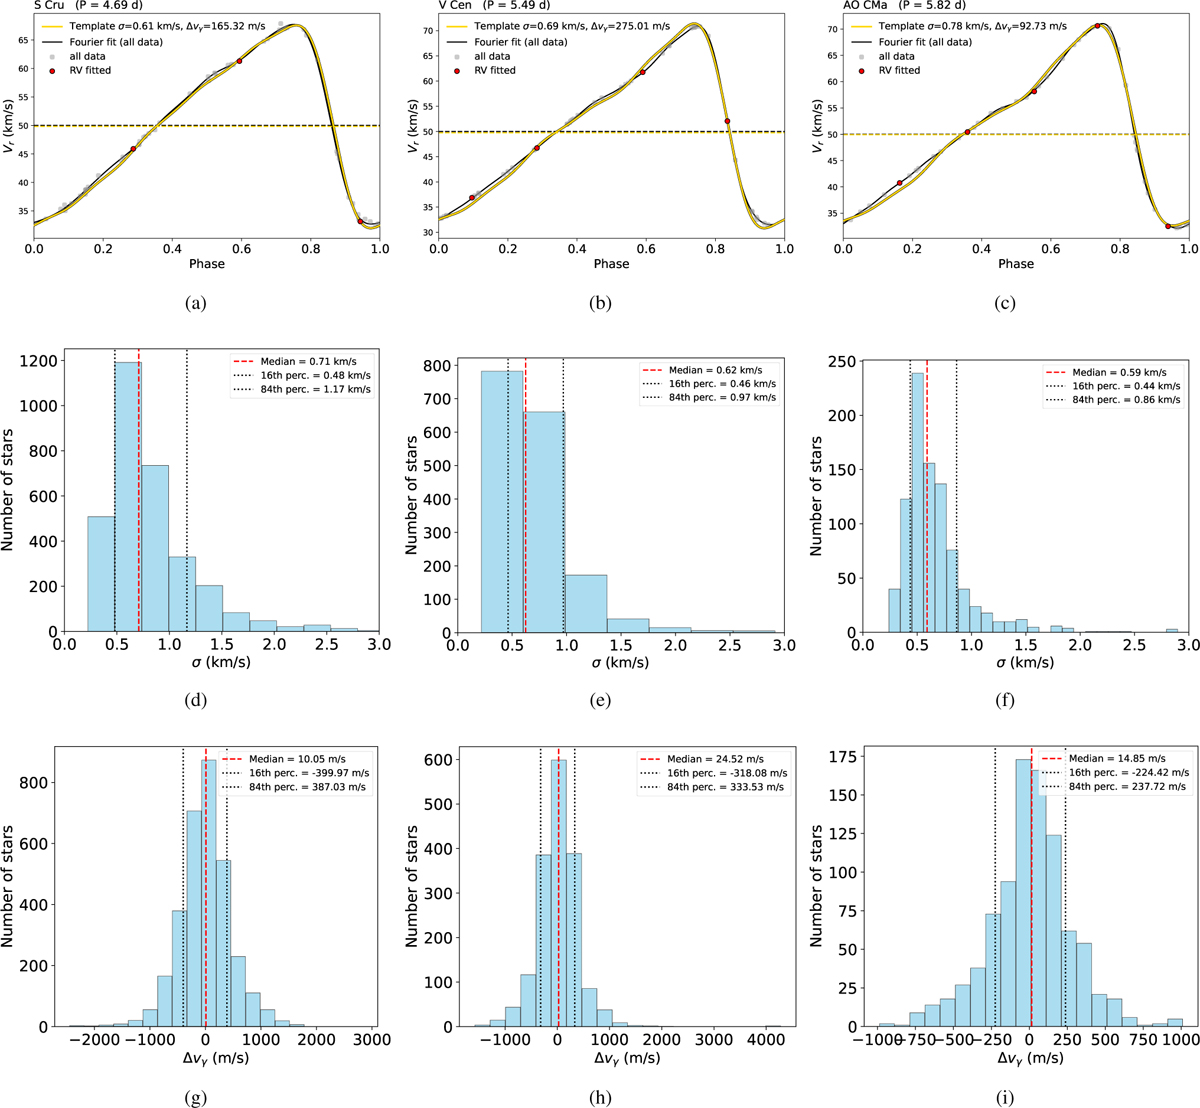
Fig. 11
Download original image
Template fitting accuracy for 3, 4, and 5 RV measurements in each column, respectively. The first row, (a–c), displays an example of template fitting for three different stars. The second row, (d–f), presents template accuracy with respect to the Fourier fit (true RV curve) obtained from bootstrapping method on the test sets. The last row, (g–i), presents the difference in systemic velocity from each template fitting with respect to the true value, also presented in Table 3.
Current usage metrics show cumulative count of Article Views (full-text article views including HTML views, PDF and ePub downloads, according to the available data) and Abstracts Views on Vision4Press platform.
Data correspond to usage on the plateform after 2015. The current usage metrics is available 48-96 hours after online publication and is updated daily on week days.
Initial download of the metrics may take a while.