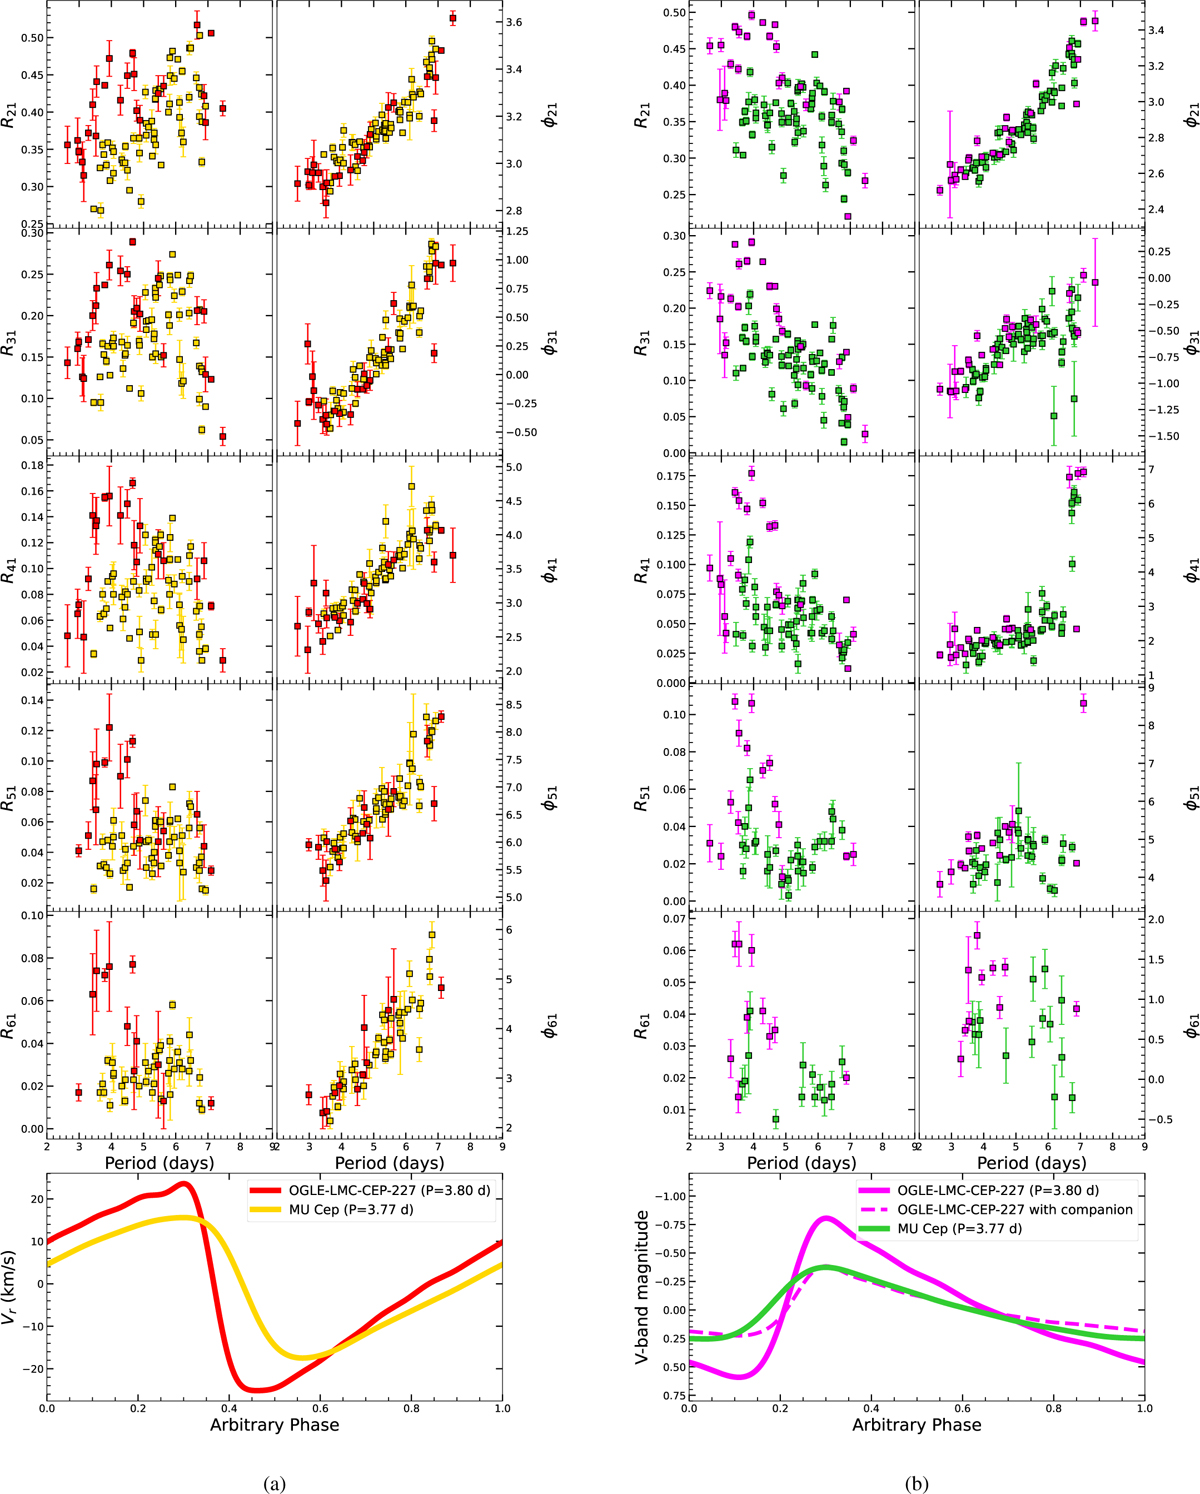
Fig. 3
Download original image
Fourier amplitude ratios and phase parameters (R21 to R61 and ϕ21 to ϕ61) of Cepheid RV curves (a) and LCs (b) as a function of the period. Models for MU Cep and OGLE-LMC-CEP-227 are shown to illustrate the difference between solar and sub-solar metallicity around P = 4 day. The solar and sub-solar metallicity variables are plotted with yellow and red error bars (magenta and green, respectively) for the RV curves (LCs, respectively). Fourier parameters are derived with decomposition analysis presented in Sect. 3.
Current usage metrics show cumulative count of Article Views (full-text article views including HTML views, PDF and ePub downloads, according to the available data) and Abstracts Views on Vision4Press platform.
Data correspond to usage on the plateform after 2015. The current usage metrics is available 48-96 hours after online publication and is updated daily on week days.
Initial download of the metrics may take a while.