Open Access
Fig. 4
Download original image
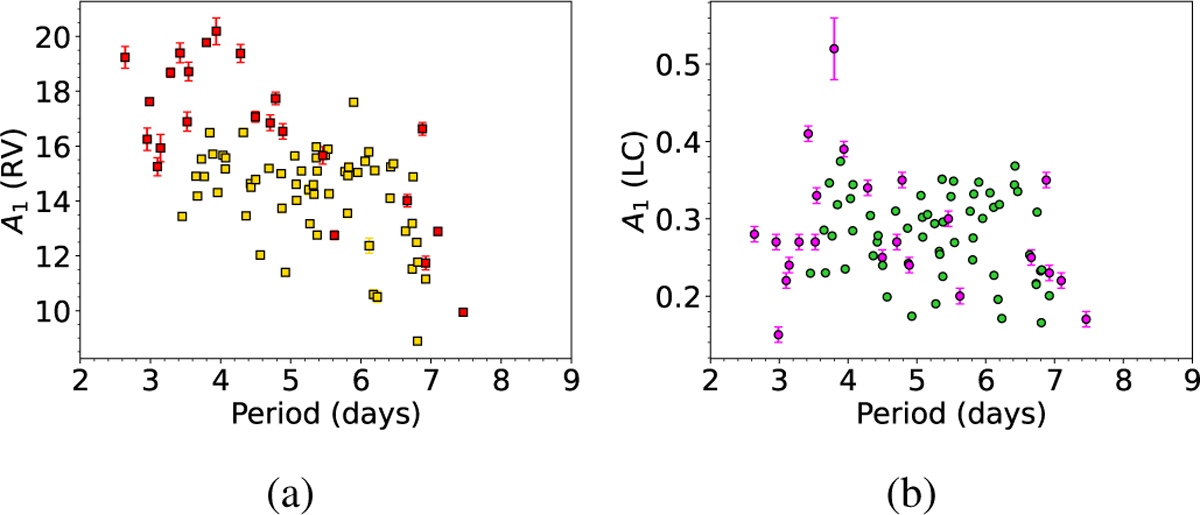
Amplitude of the first harmonic, A1, for RV curves (a) and for LCs (b). Cepheids of solar metallicity are plotted with yellow and green symbols and those of sub-solar metallicity with red and magenta symbols.
Current usage metrics show cumulative count of Article Views (full-text article views including HTML views, PDF and ePub downloads, according to the available data) and Abstracts Views on Vision4Press platform.
Data correspond to usage on the plateform after 2015. The current usage metrics is available 48-96 hours after online publication and is updated daily on week days.
Initial download of the metrics may take a while.