Open Access
Fig. 6
Download original image
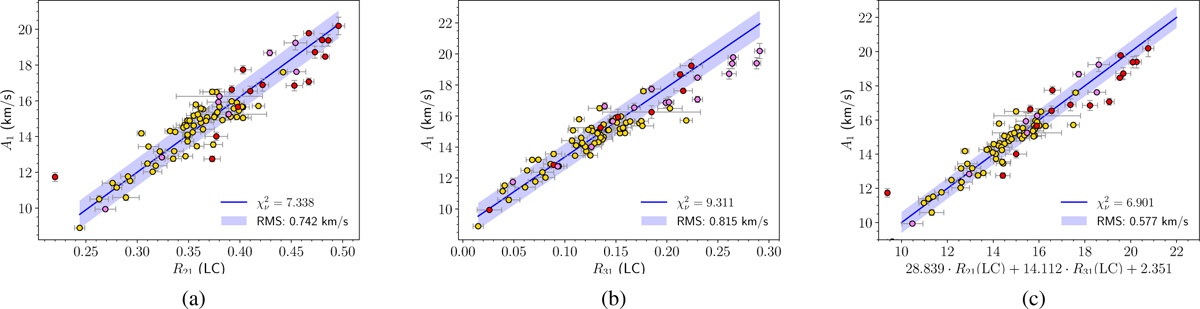
Fourier parameter A1 of the RV curves as a function of (a) R21(LC), (b) R31(LC), and (c) a combination of R21(LC) and R31(LC). The ODR fit (blue line) was applied to the calibrating sample (yellow circles) and prolongated to show consistency with metal-poor stars (red circles).
Current usage metrics show cumulative count of Article Views (full-text article views including HTML views, PDF and ePub downloads, according to the available data) and Abstracts Views on Vision4Press platform.
Data correspond to usage on the plateform after 2015. The current usage metrics is available 48-96 hours after online publication and is updated daily on week days.
Initial download of the metrics may take a while.