Fig. 7
Download original image
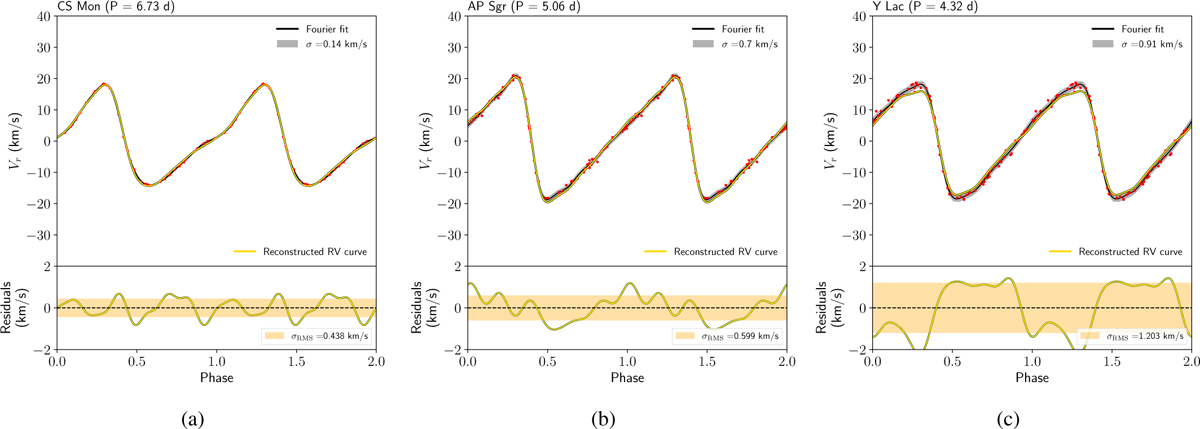
Examples of reconstructed RV curves of excellent, medium, and lower accuracy in the case of (a) CS Mon, (b) AP Sgr, and (c) Y Lac, respectively. The yellow curve shows the reconstructed RV curve using empirical relations defined in Table 1; the black curve is the Fourier fit to the RV observations (red points, see Table A.1). The accuracy of the reconstructed RV curve is defined by the standard deviation of the residuals along the pulsation cycle.
Current usage metrics show cumulative count of Article Views (full-text article views including HTML views, PDF and ePub downloads, according to the available data) and Abstracts Views on Vision4Press platform.
Data correspond to usage on the plateform after 2015. The current usage metrics is available 48-96 hours after online publication and is updated daily on week days.
Initial download of the metrics may take a while.