Fig. 3
Download original image
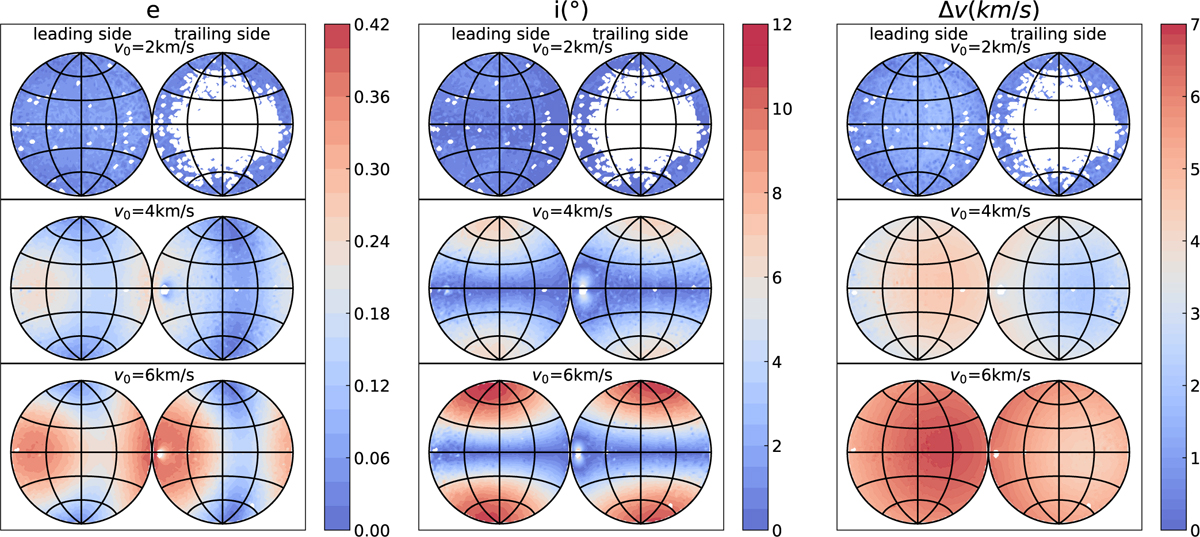
Relationship between the orbits of lunar ejecta and their initial positions at different v0. From left to right, the panels represent e, i, and Δv, respectively. Blank areas indicate ejecta that did not survive until t = 100 yr in the simulations. Black lines mark the lunar latitude and longitude grid, with longitude intervals of 45° and latitude intervals of 30°.
Current usage metrics show cumulative count of Article Views (full-text article views including HTML views, PDF and ePub downloads, according to the available data) and Abstracts Views on Vision4Press platform.
Data correspond to usage on the plateform after 2015. The current usage metrics is available 48-96 hours after online publication and is updated daily on week days.
Initial download of the metrics may take a while.