Open Access
Fig. 4
Download original image
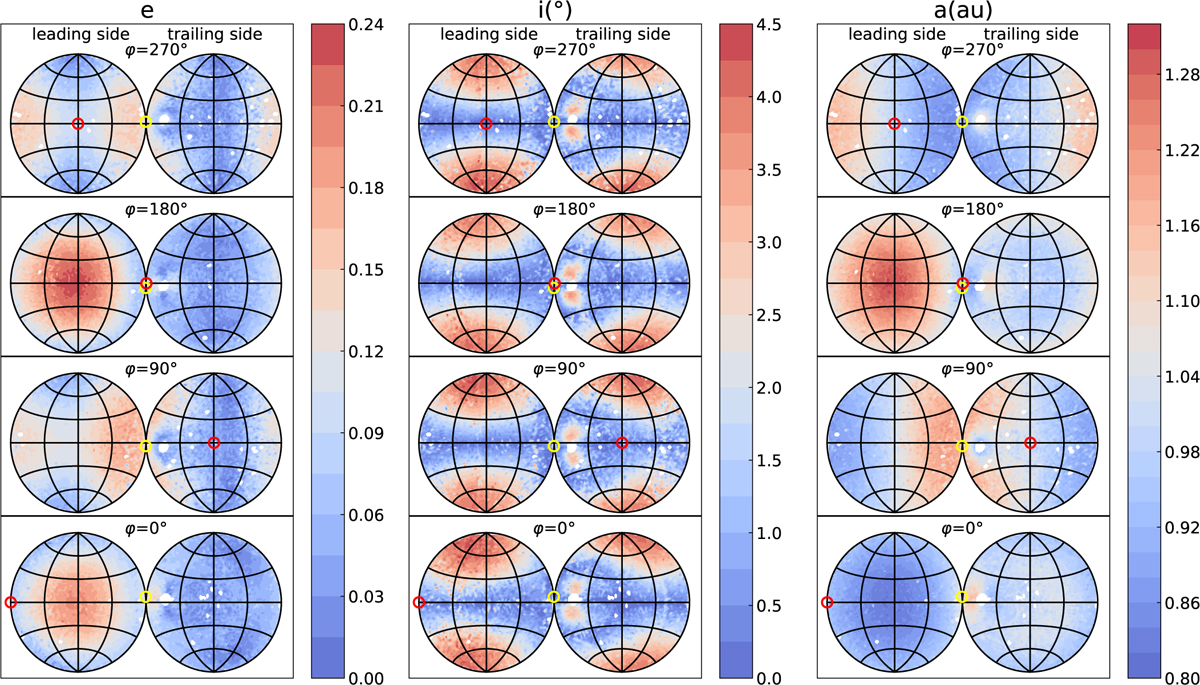
Similar to Fig. 3, but the right column represents the semimajor axes of the ejecta and panels from top to bottom represent different lunar phases. In the plots, the v0 of all lunar ejecta is 3 km/s. The open yellow and red circles mark the directions of Earth and the Sun, as viewed from the Moon, respectively.
Current usage metrics show cumulative count of Article Views (full-text article views including HTML views, PDF and ePub downloads, according to the available data) and Abstracts Views on Vision4Press platform.
Data correspond to usage on the plateform after 2015. The current usage metrics is available 48-96 hours after online publication and is updated daily on week days.
Initial download of the metrics may take a while.