Fig. 6
Download original image
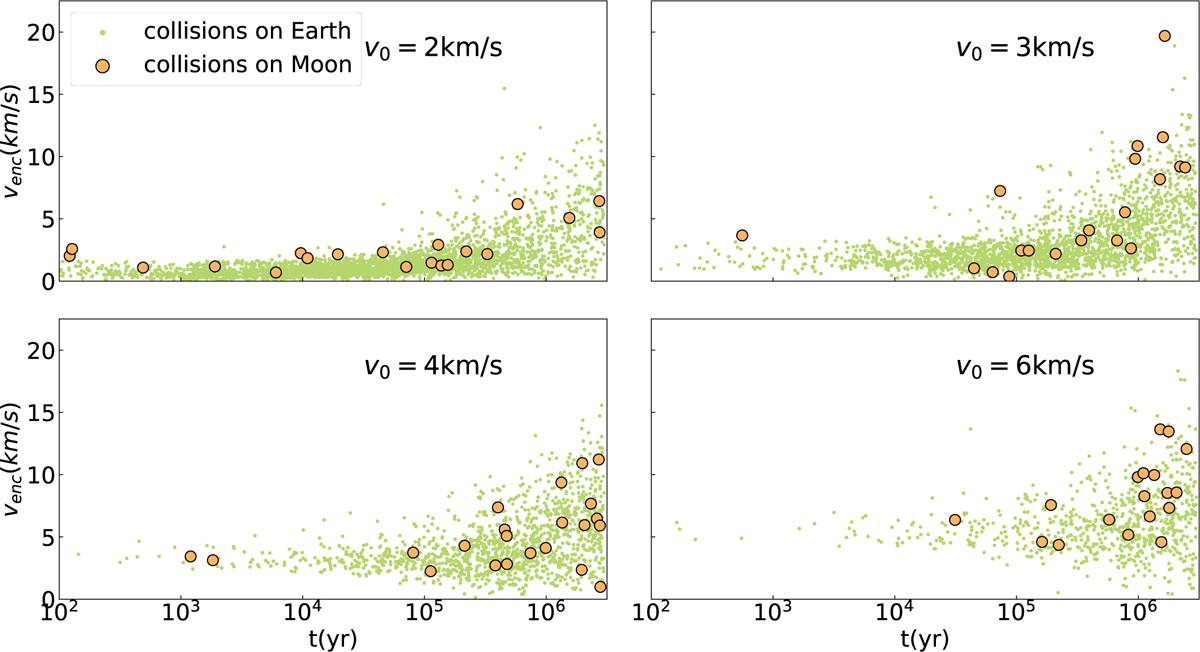
Distribution of time and venc for collision events on Earth–Moon system. The x-axis represents time on a logarithmic scale, while the y-axis shows the venc, which indicates the velocities of impactors as they enter the Hill radius of the Earth–Moon system. For clarity, impacts on the Moon are highlighted with larger markers.
Current usage metrics show cumulative count of Article Views (full-text article views including HTML views, PDF and ePub downloads, according to the available data) and Abstracts Views on Vision4Press platform.
Data correspond to usage on the plateform after 2015. The current usage metrics is available 48-96 hours after online publication and is updated daily on week days.
Initial download of the metrics may take a while.