Fig. 1
Download original image
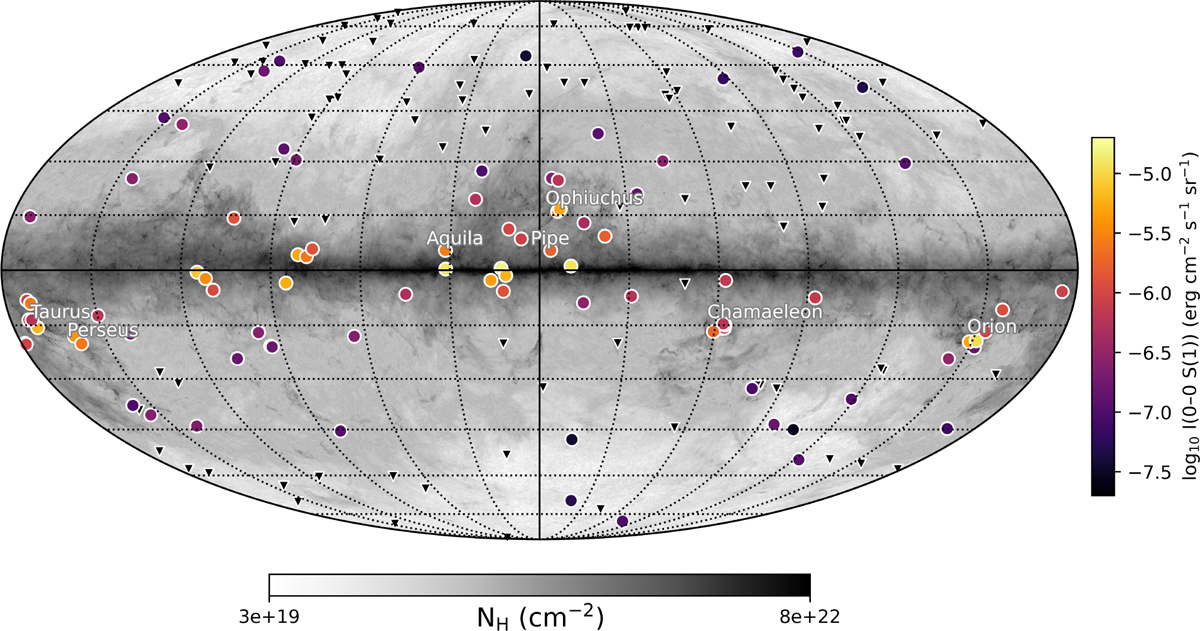
Aitoff projection of the MRS background lines of sight analyzed in this paper. Filled circles indicate detections of the 0–0 S(1) line of H2, color-coded by integrated intensity, while triangles show non-detections. All lines of sight are overlaid on the total hydrogen column density map derived from the dust opacity at 353 GHz measured by Planck (Planck Collaboration XI 2014).
Current usage metrics show cumulative count of Article Views (full-text article views including HTML views, PDF and ePub downloads, according to the available data) and Abstracts Views on Vision4Press platform.
Data correspond to usage on the plateform after 2015. The current usage metrics is available 48-96 hours after online publication and is updated daily on week days.
Initial download of the metrics may take a while.