| Issue |
A&A
Volume 709, May 2026
|
|
|---|---|---|
| Article Number | A152 | |
| Number of page(s) | 11 | |
| Section | Interstellar and circumstellar matter | |
| DOI | https://doi.org/10.1051/0004-6361/202659079 | |
| Published online | 13 May 2026 | |
Turning JWST/MIRI backgrounds into a survey of diffuse molecular hydrogen
1
Laboratoire de Physique de l’École Normale Supérieure, ENS, Université PSL, CNRS, Sorbonne Université,
75005
Paris,
France
2
LUX, Observatoire de Paris, Université PSL, Sorbonne Université, CNRS,
75014
Paris,
France
3
Institut d’Astrophysique de Paris, Sorbonne Université, CNRS,
98 bis bd Arago,
75014
Paris,
France
4
Institut d’Astrophysique Spatiale, Université Paris-Saclay, CNRS,
91405
Orsay,
France
★ Corresponding author: This email address is being protected from spambots. You need JavaScript enabled to view it.
Received:
22
January
2026
Accepted:
13
March
2026
Abstract
Context. A statistically significant sampling of H2 rotational excitation in the diffuse interstellar medium (ISM) is essential to identifying its excitation mechanisms and assessing the importance of H2 in the cooling of the gas and the regulation of thermal pressure.
Aims. To complement the statistics provided by ancillary telescopes, we conducted a search for pure rotational H2 emission lines in all publicly available background observations obtained with the Medium Resolution Spectrometer (MRS) aboard the JWST.
Methods. The sample consists of 276 background observations acquired over the past three years. Departing from the standard pipeline, each uncalibrated MRS background file was reprocessed, enabling the analysis of H2 pure rotational emission. Lines of sight likely associated with star-forming complexes were excluded to focus on emission from the diffuse ISM. The results were compared with FUSE absorption data and were analyzed in relation to the column densities of H and H2 and to dust emission derived from HI4PI, Planck, and WISE data.
Results. This analysis reveals widespread H2 emission throughout the Galaxy. We report the first detections of the pure rotational S(4), S(5), and S(7) lines in the diffuse ISM. The S(1) line is detected along 84 lines of sight, corresponding to a detection rate of 41%. Its integrated intensity decreases steeply with Galactic latitude, spanning nearly two orders of magnitude, in remarkable agreement with absorption measurements. The T34 and T35 excitation temperatures vary between 200 and ∼1000 K, are correlated with each other, and are anticorrelated with the column density of H2, as expected from ancillary data. All lines of sight in the sample have undergone the H–H2 transition, at NH ≳ 1020 cm−2, and are partly molecular, with fH2 ≳ 0.1. Under these conditions, the cooling rate associated with the S(1) line, expressed per hydrogen atom, is found to be remarkably constant, with a characteristic value of ∼4 × 10⁻²⁷ erg s−1 H−1.
Conclusions. This study demonstrates that the high sensitivity of the JWST enables measurements that both strengthen and complement those from absorption studies. Observations collected over just a fraction of JWST’s lifetime have already yielded detections along dozens of lines of sight, significantly expanding the statistical sample of H2 rotational excitation in the diffuse ISM.
Key words: methods: data analysis / methods: observational / techniques: spectroscopic / ISM: lines and bands / ISM: molecules
© The Authors 2026
 Open Access article, published by EDP Sciences, under the terms of the Creative Commons Attribution License (https://creativecommons.org/licenses/by/4.0), which permits unrestricted use, distribution, and reproduction in any medium, provided the original work is properly cited.
This article is published in open access under the Subscribe to Open model. This email address is being protected from spambots. You need JavaScript enabled to view it. to support open access publication.
1 Introduction
Understanding the formation, survival, and excitation of molecular hydrogen is a long-standing objective in studies of the interstellar medium (ISM). First, H2 surface density correlates with the star formation rate (e.g., Lin et al. 2019) and provides a valuable tracer for understanding the Kennicutt–Schmidt relation and its spatial variations in galaxies (e.g., Leroy et al. 2013; Pessa et al. 2022). Second, as the most abundant molecule in the Universe, H2 initiates interstellar chemistry and the formation of complex species in space. Last, while the cooling of the two stable phases of the diffuse ISM, the warm neutral medium (WNM) and the cold neutral medium (CNM), is presumably dominated by atomic species (Wolfire et al. 2003), H2 plays a subtle but essential role in cooling the gas. By preventing the CNM from evaporating into the WNM, H2 cooling suppresses thermal instability and regulates the thermal pressure of the diffuse gas and, hence, the relative distributions of the WNM and CNM (Godard et al. 2023).
The first detection of molecular hydrogen in the local diffuse ISM was obtained with UV rocket observations (Carruthers 1970) and was later confirmed and extensively characterized by the Copernicus satellite via resonant electronic absorption lines of H2 toward nearby OB stars (e.g., Spitzer & Jenkins 1975; Savage et al. 1977; Shull & Beckwith 1982). These early studies were later expanded upon using measurements by the Far Ultraviolet Spectroscopic Explorer (FUSE), which targeted more distant and fainter sources both in the Galactic disk (e.g., Rachford et al. 2002; Shull et al. 2021) and at higher Galactic latitudes toward extragalactic background sources (e.g., Gillmon et al. 2006; Gillmon & Shull 2006; Wakker 2006). The first detection of H2 pure rotational emission from diffuse Galactic regions came with the Infrared Space Observatory (ISO), which measured the S(0) to S(3) lines along a line of sight across the Galactic midplane (Falgarone et al. 2005). This discovery was later extended with Spitzer observations of the first pure rotational lines of H2 in emission toward two translucent clouds at high Galactic latitudes associated with infrared cirrus emission (Ingalls et al. 2011).
On the one hand, observations performed in absorption have provided access to the so-called H–H2 transition and, more importantly, to the statistical distribution of the molecular fraction along random lines of sight. In the local diffuse ISM, this transition occurs at total hydrogen column densities NH ∼ 1020−1021 cm−2, with a mean transition column density that depends on the Galactic latitude (Gillmon et al. 2006). Across this range, the molecular fraction increases by several orders of magnitude and approaches a mean value of  , with decreasing dispersion at higher column densities, reflecting line-of-sight averaging over long distances. Initially interpreted as a signature of H-to-H2 conversion within individual clouds, this transition is now understood to reflect the underlying multiphase structure of the gas (Bellomi et al. 2020). The distribution of H2 column densities traces the probability of encountering CNM structures along a given line of sight, which itself results from thermal instability and is ultimately regulated by Galactic-scale properties such as the mean density of the diffuse ISM, the intensity of the ambient UV radiation field, and the typical separation between OB associations.
On the other hand, observations of H2 in both emission and absorption have provided access to its excitation in its pure rotational levels. While the lowest two rotational states (J = 0, 1) appear to be thermally coupled with the gas at a kinetic temperature close to that of the CNM (∼80 K), higher rotational states display excitation temperatures of a few hundred Kelvin that anticorrelate with the column density of molecular hydrogen (Spitzer et al. 1974; Savage et al. 1977; Wakker 2006; Shull et al. 2021). Two competing processes are invoked to account for the excitation of these rotational states: collisions in warm environments and far-UV pumping of the electronic transitions followed by fluorescent decay. Multiple studies have shown that the populations of several rotational levels cannot be explained by far-UV pumping alone (Gry et al. 2002; Falgarone et al. 2005; Nehmé et al. 2008; Ingalls et al. 2011) and instead require collisional excitation in gas at temperatures of a few hundred Kelvin along the line of sight. This warm H2 component, which is connected to the presence of CH+ in the diffuse ISM (e.g., Frisch & Jura 1980; Lambert & Danks 1986), may arise from the dissipation of mechanical energy (e.g., Godard et al. 2009, 2014; Myers et al. 2015; Lesaffre et al. 2020; Moseley et al. 2021) or from the evaporation of CNM structures (Valdivia et al. 2016; Godard et al. 2023; Godard 2025). In this context, assembling a large observational sample is essential to enable statistical analyses of H2 excitation and to constrain models of multiphase, turbulent gas, as such statistics provide insight far beyond what can be inferred from individual lines of sight.
The present study aims to expand the statistical sampling of H2 rotational excitation in the diffuse ISM by searching for pure rotational line emission in all available background observations collected by the Medium Resolution Spectrometer (MRS) aboard the James Webb Space Telescope (JWST). This approach potentially enables the detection of H2 from the S(1) to S(8) transitions.
2 JWST MIRI-MRS data
2.1 MRS backgrounds and data reduction
The recommended observation strategy for JWST/MRS programs is to measure the background level using dedicated, co-temporal observations of a nearby region in the sky selected to be free of target emission. These background observations are primarily used to remove the sky and telescope contributions (including zodiacal light and thermal emission1), and to mitigate detector artifacts such as temporal variations in the hot and warm pixels and coherent striping produced by drifts in the effective detector dark current that are currently not captured by the standard calibration pipeline2. Such detector systematics are best calibrated using dedicated backgrounds with the same readout ramp length as the science data.
Dithering offsets the target on the detector between exposures, improving spatial sampling and helping reject bad pixels and cosmic-ray residuals when the exposures are combined. A large fraction of MRS backgrounds used in this paper are taken with a two-point extended source dither pattern with detector readout mode and parameters (including exposure time set by the Ngroups parameter) matched to that used for the science exposures. This is, in most cases, sufficient to mitigate the effects of bad pixels and cosmic rays (Law et al. 2025). In other cases, the data consist of either a single background position (i.e, no dithering) or a four-point extended dither pattern, with a total exposure depth comparable to that of the science observation, as typically used for very faint targets. The MRS covers a total wavelength range from 4.9 to 27.9 µm, separated into four integral field units (IFUs) referred to as channels, each divided into three bands. The channels cover slightly different fields of view (FoVs), from 3.2″×3.7″ (channel 1) up to 6.6″×7.7″ (channel 4), and have different spectral resolutions (from ∼3700 to ∼1500, Labiano et al. 2021).
Dedicated backgrounds (i.e., indicated as such in the Astronomer Proposal Tool) are generally not used directly for scientific purposes, and they are automatically subtracted from science observations in the pipeline. Therefore, for our purpose, we re-reduced the uncalibrated background MRS files up to level3 calibrated spectral cubes, the standard analysis-ready data product for IFU observations. The data reduction was done with the JWST Science Calibration Pipeline (version 1.17.1, Bushouse et al. 2025), with the context 1350 for the Calibration References Data System following the standard procedures (see, e.g., Labiano et al. 2016 and Álvarez-Márquez et al. 2023 for detailed examples of MRS data reduction and calibration). Careful examination of the data showed that the stage 1 corrections (Morrison et al. 2023) could be run with default parameters, and did not reveal significant residual impacting line emission. Naturally, we switched off the master background correction and sky matching steps in stage 3 of the pipeline, before producing the final fully reconstructed science cubes (Law et al. 2023). We did not realign the MRS astrometry thanks to the simultaneous imaging data. Finally, the science cubes were shifted to the usual orientation with north up and east to the left, increasing the total FoV in channel 1 to 6.1″×5.6″ and up to 11.5″×11.5″ in channel 4.
2.2 Lines of sight selection
The data reduction described above was applied to all publicly available Mid-InfraRed Instrument-MRS (MIRI-MRS) observations retrieved from the Mikulski Archive for Space Telescopes (MAST). As of November 2025, this resulted in 297 individual lines of sight, each observed in at least one of the four spectral channels of the MRS instrument. Among these, 21 lines of sight were excluded from the sample. Programs targeting bodies in the Solar System were rejected due to contamination of the background spectra by diffuse light scattered from the primary target (e.g., Bockelée-Morvan et al. 2024), while lines of sight toward the Galactic center were excluded because their mid-infrared emission is dominated by dense environments rather than by the diffuse ISM.
The spectral properties of the final sample, which comprises 276 lines of sight, and the procedures used to extract and identify H2 rotational emission are described in Appendix A. The corresponding measurements are summarized in Tables A.1 and A.2, which report, respectively, the integrated intensities measured for all detected H2 rotational lines in each spectrum and the detection statistics for each transition. To support the interpretation of the data, we also compiled estimates of the atomic and total hydrogen column densities, as well as the dust temperature and its 12 µm emission, along each line of sight using all-sky surveys. These complementary data are discussed in Appendix B and listed in Table B.1. Although these estimates are derived over solid angles at least 25 times larger than the MRS FoV, they provide valuable contextual information.
A subset of the final sample is displayed in Fig. 1, which shows the distribution of lines of sight in Galactic coordinates, as well as the integrated intensity of the H2 0–0 S(1) line, used throughout this paper as a reference for the study of warm and diffuse molecular hydrogen. Several background lines of sight exhibit rotational H2 emission significantly higher than the bulk of the sample. Upon further inspection, a fraction of these highly emissive lines of sight are associated with the Orion, Ophiuchus, Perseus, and Chamaeleon cloud complexes, all located near regions of active star formation. To exclude such environments and focus on the diffuse ISM, we devised selection criteria based on the total hydrogen column density and the dust temperature, as described in Appendix B.3. Applying these criteria led to the flagging of 43 observations as non-diffuse, leaving a final sample of 233 lines of sight intersecting the diffuse ISM.
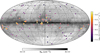 |
Fig. 1 Aitoff projection of the MRS background lines of sight analyzed in this paper. Filled circles indicate detections of the 0–0 S(1) line of H2, color-coded by integrated intensity, while triangles show non-detections. All lines of sight are overlaid on the total hydrogen column density map derived from the dust opacity at 353 GHz measured by Planck (Planck Collaboration XI 2014). |
3 Diffuse H2 emission and excitation
We report widespread detections of H2 pure rotational line emission originating from Galactic material. After excluding the flagged lines of sight, the S(1) line is detected along 84 lines of sight, up to Galactic latitudes of 78°. Most detections correspond to molecular hydrogen column densities between 1019 and 1022 cm−2, with line intensities and excitation properties consistent with absorption measurements in the solar neighborhood. This consistency indicates that the emission predominantly arises from diffuse, largely local interstellar gas3. In this context, we also report the first detections of the pure rotational S(4), S(5), and S(7) lines in the local diffuse ISM. As the detection rate generally decreases with increasing rotational quantum number (see Table A.2), the S(6) and S(8) lines are not detected. The spontaneous Einstein coefficient of the J → J − 2 pure rotational transition approximately scales as J6 between J = 2 and J = 9 (Shull & Hollenbach 1978). This decrease in detection rate therefore reflects the sharp drop in the level populations as J increases.
3.1 Variations with galactic latitude
The integrated intensities of the H2 0–0 S(1) line are shown in Fig. 2 as functions of the absolute Galactic latitude of the lines of sight, |b|. The measured intensities span more than two orders of magnitude and display a steep decline with increasing latitude, in excellent agreement with values inferred from absorption studies. For exposure times of a few minutes – which apply to most MRS background pointings – the sensitivity limit is ∼10−7 erg cm−2 s−1 sr−1. This limit corresponds to a column density of the J = 3 level of 2 × 1016 cm−2 (see Eq. (A.1)), approximately two orders of magnitude higher than the detection threshold reached in absorption.
Interestingly, the upper envelope of the emission follows a well-defined trend that reflects the vertical distribution of molecular gas in the solar neighborhood. Assuming that the local diffuse ISM can be described by two partially molecular components, a spherical component associated with the Local Bubble and a slab representing the more extended Galactic ISM, the maximum expected emission can be written as
 (1)
(1)
C1 = 2 × 10⁻⁷ and C2 = 10−6 are the maximum emissions (in erg cm−2 s−1 sr−1) of the S(1) line perpendicular to the Galactic plane associated with the Local Bubble component and the extended Galactic ISM, respectively, each adjusted to match the data, while r = 0.5 represents the fixed ratio between the characteristic height of the molecular gas layer and the radius of the Local Bubble (e.g., Dame et al. 2001; Lallement et al. 2014). The resulting curve, shown as a dashed line in Fig. 2, closely traces the upper envelope of the observed intensities, providing further indication that the emission arises predominantly from diffuse molecular gas.
This envelope and the distribution of observed S(1) intensities are found to be symmetric with respect to b = 0. There is, however, a statistically significant difference in the detection rate of the S(1) line between northern and southern lines of sight. Although the sample contains twice as many northern lines of sight as southern ones, the detection rate is a factor of two higher in the south, independently of Galactic latitude. This difference cannot be attributed to a bias in integration time, as the northern and southern subsamples have identical integration time distributions. The asymmetry therefore reflects a higher probability of intercepting molecular regions along southern lines of sight, while the intrinsic emission properties of the gas remain unchanged, consistent with the distribution of molecular structures at high Galactic latitude revealed by Röhser et al. (2016).
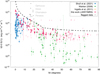 |
Fig. 2 Integrated intensities of the 0–0 S(1) line of H2 as a function of the absolute Galactic latitude, |b|. Green squares and blue stars correspond to values inferred from absorption measurements toward extragalactic targets and nearby OB stars observed with FUSE (Wakker 2006; Shull et al. 2021), using Eq. (A.1) and the column densities of the J = 3 rotational level. Yellow triangles show measurements obtained with Spitzer by Ingalls et al. (2011). Gray and red points represent intensities measured along flagged and un-flagged MRS background lines of sight, respectively, while red arrows indicate upper limits set by the sensitivity of the MRS over the wide range of exposure times in the sample. The dashed line shows a geometrically motivated analytical estimate of the maximum expected emission (Eq. (1)). |
3.2 Excitation properties
The distribution of H2 among its rotationally excited states is shown in Fig. 3, which presents excitation diagrams constructed from the column densities of individual rotational levels, normalized by their statistical weights and by the estimated H2 column density (Appendix B), as functions of the level energies. These excitation diagrams exhibit a striking consistency with those derived from absorption studies, in terms of both population ratios and the range of column densities probed (see Fig. 1.16 of Godard 2025). As found in previous work (e.g., Gry et al. 2002), the rotational populations depart from Local Thermal Equilibrium and display excitation temperatures that increase with the rotational quantum number J. In addition, and as reported by Wakker (2006), the excitation of the rotational levels is linked to the column density of molecular hydrogen. As N(H2) increases, the fraction of H2 in its excited rotational states generally decreases, and the excitation diagrams presumably converge toward a mean distribution resulting from the statistical averaging along increasingly complex lines of sight.
To further quantify the excitation of H2 in the diffuse ISM, we display in Fig. 4 the excitation temperatures T34 and T35, inferred from the populations of the J = 3, 4, and 5 rotational levels. Because it involves both para- and ortho-rotational levels, T34 serves as a proxy for the overall excitation of H2 that encodes the combined effects of ortho–para conversion and nonreactive excitation processes. Keeping this important aspect in mind, T34 and T35 are found to lie between 200 and ∼1000 K, in agreement with the values derived from absorption studies. As shown in Fig. 4, the two excitation temperatures, derived from our sample and the lines of sight observed in absorption, follow a simple power-law relation,
 (2)
(2)
where the errors on each parameter correspond to the 3σ marginalized uncertainties derived from the posterior distribution. Taken together, the results presented in Figs. 3 and 4 provide paramount empirical constraints on the excitation conditions of molecular hydrogen in the diffuse ISM. In particular, they encode statistical information on the variations of the ortho-to-para ratio and on the distribution of densities, temperatures, and UV irradiation along a random set of lines of sight.
It has been proposed that the rotational excitation of H2 is enhanced by UV pumping due to the interaction with the background source along lines of sight targeting hot OB-type stars (e.g., Shull et al. 2021). In contrast, the JWST observations analyzed here probe H2 emission along lines of sight that do not target specific background sources and are, a priori, not tied to the presence of nearby massive stars. The fact that the excitation properties, in terms of both excitation diagrams and T34–T35 distributions, are similar suggests either that the contribution of local stellar environments is difficult to disentangle from the cumulative excitation along the line of sight, or that their net impact on the averaged excitation properties is limited. A natural interpretation is that the observed excitation arises from a combination of collisional excitation and radiative pumping by the ambient interstellar radiation field integrated along extended path lengths, as found in recent numerical simulations of the diffuse multiphase ISM (see Fig. 1.20 of Godard 2025).
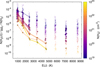 |
Fig. 3 Excitation diagrams of H2 derived along the MRS background lines of sight, excluding the flagged data. The column densities of each rotational level are derived from the corresponding line intensities using Eq. (A.1) and are normalized and color-coded by the H2 column density estimated in Appendix B. For visual clarity, data points are slightly offset along the energy axis by small random values. Detections, along a given line of sight, of all successive rotational transitions up to at least the S(3) line are connected by segments. |
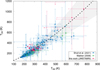 |
Fig. 4 Excitation temperature T34 between the J = 3 and J = 4 levels as a function of the excitation temperature T35 between the J = 3 and J = 5 levels. Green squares and blue stars correspond to values inferred from absorption measurements toward extragalactic targets and nearby OB stars observed with FUSE (Wakker 2006; Shull et al. 2021). Red points and arrows show measurements and upper limits, respectively, obtained along MRS background lines of sight after excluding flagged data. The dashed black line shows a power-law relation derived between the two temperatures (Eq. (2)), and the shaded region is an envelope obtained by varying each fit parameter independently within its marginalized ±3σ uncertainty, which encloses 78% of the data points. |
3.3 Cooling rate
The contribution of pure rotational H2 emission to the energy budget of the diffuse ISM is investigated in Fig. 5, which shows the fluxes of the 0–0 S(1) line as a function of the total hydrogen column density, NH. Combining the MRS background measurements with the values inferred from absorption studies toward high-Galactic-latitude extragalactic sources reveals a sharp increase in S(1) emission at column densities between 1020 and 1021 cm−2. This behavior coincides with the onset of the H– H2 transition in diffuse interstellar gas, marking the transition from a predominantly atomic to a partially molecular medium (e.g., Bellomi et al. 2020). Because emission measurements are less sensitive than absorption, the entire MRS sample probes lines of sight with substantial H2 column densities that have already undergone the H–H2 transition.
As established from absorption studies, the cooling associated with H2 emission per unit column density of gas, as well as its partition among the various rotational lines, is expected to vary from one line of sight to another. In particular, the 0–0 S(1) line typically contributes between 5 and 95% of the cooling carried by the rotational ladder. Nevertheless, Fig. 5 shows that once the H–H2 transition is reached, the cooling rate of the S(1) line per hydrogen atom,
 (3)
(3)
remains nearly constant, with a dispersion of less than a factor of two over nearly three orders of magnitude in total hydrogen column density. This cooling rate corresponds to about 20% of the cooling rate of the [C II] 158 µm line measured in diffuse gas at high Galactic latitudes (Bock et al. 1993; Lehner et al. 2004). Over the same range of column density, the S(1) line intensity amounts to 0.6% of the polycyclic aromatic hydrocarbon (PAH) surface brightness at 12 µm measured by the Wide-field Infrared Survey Explorer (WISE) (Meisner & Finkbeiner 2014), again with a dispersion smaller than a factor of two. These results are consistent with Hensley et al. (2016), who showed that the PAH fraction increases in diffuse gas and reaches a plateau at NH ≳ 8 × 1020 cm−2.
The fact that ΛS(1) and its ratio to the 12 µm PAH emission remain approximately constant beyond the H–H2 transition constitutes a new and important result. It provides a link between the physics of WNM–CNM phase transitions, CNM irradiation, H2 formation, ortho-to-para conversion processes, and H2 excitation in diffuse gas. In particular, the value inferred from the MRS data (Eq. (3)) is larger than that predicted by models of static photodissociation regions as recently found by Goldsmith et al. (2025).
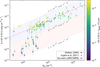 |
Fig. 5 Flux of the 0–0 S(1) line of H2 as a function of the total hydrogen column density, NH (Table B.1). Filled squares correspond to values inferred from absorption measurements toward extragalactic targets observed with FUSE (Wakker 2006). Filled circles show intensities measured along MRS background lines of sight after excluding flagged data. Points are color-coded by the ratio of the S(1) integrated intensity to the PAH surface brightness at 12 µm measured by WISE (Table B.1). The three dotted gray lines indicate constant values of the S(1) cooling rate per hydrogen atom. The dashed red line shows a fit to the S(1) cooling rate derived from the MRS sample only (Eq. (3)). |
4 Conclusions and perspectives
This paper introduces a novel observational strategy for probing the diffuse ISM that requires no dedicated telescope time. It demonstrates that diffuse H2 emission can be readily detected by systematically analyzing the backgrounds of existing JWST observations. This method significantly enhances the scientific yield of the JWST by leveraging data that would otherwise remain unused. The main results can be summarized as follows.
Of the 297 background observations acquired over the past three years with the MRS instrument, 233 are identified as probing the diffuse, predominantly local ISM. We report the detection of the pure rotational S(1) line of H2 along 41% of these lines of sight, together with the first detections of the S(4), S(5), and S(7) pure rotational lines in the diffuse ISM.
Because of sensitivity limits, most detections correspond to lines of sight that have undergone the H–H2 transition, with molecular hydrogen column densities between 1019 and 1022 cm−2.
The S(1) line is detected over a wide range of Galactic latitudes, up to |b| = 78°. Its intensity spans more than two orders of magnitude and exhibits a steep decline with increasing Galactic latitude, reflecting both the finite vertical extent of molecular gas above the Galactic disk and the radial extent of the Local Bubble.
The intrinsic emission properties of H2 are symmetric with respect to b = 0. However, the detection rate differs between northern and southern Galactic lines of sight, with the S(1) line detected twice as often in the south.
The spatial distribution and excitation properties of H2 emission are consistent with those inferred from absorption studies conducted with FUSE. In particular, the excitation temperatures T34 and T35, which trace ortho–para conversion and nonreactive excitation processes, lie between 200 and ∼1000 K. These temperatures are well correlated with each other and anticorrelated with the H2 column density.
Beyond expanding the statistical sample of Galactic H2 emission, this study reveals a new cooling law for the diffuse ISM. When contextualized with Planck and WISE data, lines of sight that have undergone the H–H2 transition show a remarkably constant S(1) cooling rate per hydrogen atom, with a mean value of ∼4 × 10⁻²⁷ erg s−1 H−1 and a dispersion of less than a factor of two over nearly three orders of magnitude in total column density. The S(1) line intensity amounts to 20% of the cooling rate of the [C II] 158 µm line derived at high Galactic latitudes, and 0.6% of the PAH surface brightness at 12 µm, again with a dispersion smaller than a factor of two.
The widespread emission from rotationally excited H2 across the Galaxy offers a powerful complement to traditional absorption studies. While absorption data provide precise measurements of total H2 column densities and the ortho-to-para ratio with unmatched sensitivity, they are limited to rare, bright UV background sources. In contrast, current and future JWST observations enable a dramatic increase in statistical coverage across the sky and access to higher rotational levels that were previously undetectable in the diffuse ISM. In this study we focused on MRS data to demonstrate that this emission arises from diffuse gas. Ongoing work focuses on NIRSpec data, opening the door to the first systematic detection of diffuse rovibrational H2 emission.
Data availability
The full versions of Tables A.1 and B.1 are available at the CDS via https://cdsarc.cds.unistra.fr/viz-bin/cat/J/A+A/709/A152.
Acknowledgements
We thank the referee, J. M. Shull, for a thorough reading of the manuscript and for comments that greatly improved the paper. This work is based on observations made with the NASA/ESA/CSA James Webb Space Telescope. The data were obtained from the Mikulski Archive for Space Telescopes at the Space Telescope Science Institute, which is operated by the Association of Universities for Research in Astronomy, Inc., under NASA contract NAS 5-03127 for JWST. The research leading to these results has received financial support by the DIM ORIGINES program from Région Île de France. We would also like to acknowledge the support from the Thematic Actions “Cosmologie et Galaxies” (CG) and “Physique et Chimie du Milieu Interstellaire” (PCMI) of INSU Programme National “Astro”, with contributions from CNRS Physique and CNRS Chimie, INP and IN2P3, CEA, and CNES. The data gathering and processing was made possible by using the CANDIDE cluster at the Institut d’Astrophysique de Paris. The cluster was funded through grants from the PNCG, CNES, DIM-ACAV, the Euclid Consortium, and the Danish National Research Foundation Cosmic Dawn Center (DNRF140). It is maintained by Stephane Rouberol.
References
- Álvarez-Márquez, J., Labiano, A., Guillard, P., et al. 2023, A&A, 672, A108 [NASA ADS] [CrossRef] [EDP Sciences] [Google Scholar]
- Argyriou, I., Glasse, A., Law, D. R., et al. 2023, A&A, 675, A111 [NASA ADS] [CrossRef] [EDP Sciences] [Google Scholar]
- Bellomi, E., Godard, B., Hennebelle, P., et al. 2020, A&A, 643, A36 [NASA ADS] [CrossRef] [EDP Sciences] [Google Scholar]
- Bock, J. J., Hristov, V. V., Kawada, M., et al. 1993, ApJ, 410, L115 [Google Scholar]
- Bockelée-Morvan, D., Lellouch, E., Poch, O., et al. 2024, A&A, 681, A27 [NASA ADS] [CrossRef] [EDP Sciences] [Google Scholar]
- Bushouse, H., Eisenhamer, J., Dencheva, N., et al. 2025, https://doi.org/10.5281/zenodo.6984365 [Google Scholar]
- Carruthers, G. R. 1970, ApJ, 161, L81 [Google Scholar]
- Castro Neto, A. H., Guinea, F., Peres, N. M. R., Novoselov, K. S., & Geim, A. K. 2009, Rev. Mod. Phys., 81, 109 [CrossRef] [Google Scholar]
- Compiègne, M., Verstraete, L., Jones, A., et al. 2011, A&A, 525, A103 [Google Scholar]
- Dame, T. M., Hartmann, D., & Thaddeus, P. 2001, ApJ, 547, 792 [Google Scholar]
- Draine, B. T., & Li, A. 2007, ApJ, 657, 810 [CrossRef] [Google Scholar]
- Falgarone, E., Verstraete, L., Pineau des Forêts, G., & Hily-Blant, P. 2005, A&A, 433, 997 [NASA ADS] [CrossRef] [EDP Sciences] [Google Scholar]
- Frisch, P. C., & Jura, M. 1980, ApJ, 242, 560 [Google Scholar]
- Gillmon, K., & Shull, J. M. 2006, ApJ, 636, 908 [Google Scholar]
- Gillmon, K., Shull, J. M., Tumlinson, J., & Danforth, C. 2006, ApJ, 636, 891 [NASA ADS] [CrossRef] [Google Scholar]
- Godard, B. 2025, Habilitation à diriger des recherches, Observatoire de Paris, France [Google Scholar]
- Godard, B., Falgarone, E., & Pineau des Forêts, G. 2009, A&A, 495, 847 [NASA ADS] [CrossRef] [EDP Sciences] [Google Scholar]
- Godard, B., Falgarone, E., & Pineau des Forêts, G. 2014, A&A, 570, A27 [NASA ADS] [CrossRef] [EDP Sciences] [Google Scholar]
- Godard, B., Pineau des Forêts, G., Hennebelle, P., Bellomi, E., & Valdivia, V. 2023, A&A, 669, A74 [NASA ADS] [CrossRef] [EDP Sciences] [Google Scholar]
- Goldsmith, P. F., Wang, S., Wang, X., et al. 2025, ApJ, 985, L4 [Google Scholar]
- Gry, C., Boulanger, F., Nehmé, C., et al. 2002, A&A, 391, 675 [NASA ADS] [CrossRef] [EDP Sciences] [Google Scholar]
- Hensley, B. S., Draine, B. T., & Meisner, A. M. 2016, ApJ, 827, 45 [CrossRef] [Google Scholar]
- HI4PI Collaboration (Ben Bekhti, N., et al.) 2016, A&A, 594, A116 [NASA ADS] [CrossRef] [EDP Sciences] [Google Scholar]
- Ingalls, J. G., Bania, T. M., Boulanger, F., et al. 2011, ApJ, 743, 174 [NASA ADS] [CrossRef] [Google Scholar]
- Labiano, A., Azzollini, R., Bailey, J., et al. 2016, SPIE, 9910, 947 [Google Scholar]
- Labiano, A., Argyriou, I., Álvarez-Márquez, J., et al. 2021, A&A, 656, A57 [NASA ADS] [CrossRef] [EDP Sciences] [Google Scholar]
- Lallement, R., Vergely, J.-L., Valette, B., et al. 2014, A&A, 561, A91 [NASA ADS] [CrossRef] [EDP Sciences] [Google Scholar]
- Lambert, D. L., & Danks, A. C. 1986, ApJ, 303, 401 [NASA ADS] [CrossRef] [Google Scholar]
- Law, D. R., E. Morrison, J., Argyriou, I., et al. 2023, AJ, 166, 45 [NASA ADS] [CrossRef] [Google Scholar]
- Law, D. R., Argyriou, I., Gordon, K. D., et al. 2025, AJ, 169, 67 [Google Scholar]
- Lehner, N., Wakker, B. P., & Savage, B. D. 2004, ApJ, 615, 767 [Google Scholar]
- Leroy, A. K., Walter, F., Sandstrom, K., et al. 2013, AJ, 146, 19 [Google Scholar]
- Lesaffre, P., Todorov, P., Levrier, F., et al. 2020, MNRAS, 495, 816 [NASA ADS] [CrossRef] [Google Scholar]
- Lin, L., Pan, H.-A., Ellison, S. L., et al. 2019, ApJ, 884, L33 [NASA ADS] [CrossRef] [Google Scholar]
- Meisner, A. M., & Finkbeiner, D. P. 2014, ApJ, 781, 5 [Google Scholar]
- Miville-Deschênes, M.-A., Murray, N., & Lee, E. J. 2017, ApJ, 834, 57 [Google Scholar]
- Morrison, J. E., Dicken, D., Argyriou, I., et al. 2023, PASP, 135, 075004 [NASA ADS] [CrossRef] [Google Scholar]
- Moseley, E. R., Draine, B. T., Tomida, K., & Stone, J. M. 2021, MNRAS, 500, 3290 [Google Scholar]
- Myers, A. T., McKee, C. F., & Li, P. S. 2015, MNRAS, 453, 2747 [Google Scholar]
- Nehmé, C., Le Bourlot, J., Boulanger, F., Pineau des Forêts, G., & Gry, C. 2008, A&A, 483, 485 [NASA ADS] [CrossRef] [EDP Sciences] [Google Scholar]
- Pessa, I., Schinnerer, E., Leroy, A. K., et al. 2022, A&A, 663, A61 [NASA ADS] [CrossRef] [EDP Sciences] [Google Scholar]
- Planck Collaboration XI. 2014, A&A, 571, A11 [NASA ADS] [CrossRef] [EDP Sciences] [Google Scholar]
- Rachford, B., Snow, T., Tumlinson, J., et al. 2002, ApJ, 577, 221 [Google Scholar]
- Rigby, J. R., Lightsey, P. A., García Marín, M., et al. 2023, PASP, 135, 048002 [NASA ADS] [CrossRef] [Google Scholar]
- Röhser, T., Kerp, J., Lenz, D., & Winkel, B. 2016, A&A, 596, A94 [NASA ADS] [CrossRef] [EDP Sciences] [Google Scholar]
- Roueff, E., Abgrall, H., Czachorowski, P., et al. 2019, A&A, 630, A58 [NASA ADS] [CrossRef] [EDP Sciences] [Google Scholar]
- Savage, B. D., Bohlin, R. C., Drake, J. F., & Budich, W. 1977, ApJ, 216, 291 [NASA ADS] [CrossRef] [Google Scholar]
- Shull, J. M., & Beckwith, S. 1982, ARA&A, 20, 163 [Google Scholar]
- Shull, J. M., & Hollenbach, D. J. 1978, ApJ, 220, 525 [NASA ADS] [CrossRef] [Google Scholar]
- Shull, J. M., Danforth, C. W., & Anderson, K. L. 2021, ApJ, 911, 55 [NASA ADS] [CrossRef] [Google Scholar]
- Skalidis, R., Goldsmith, P. F., Hopkins, P. F., & Ponnada, S. B. 2024, A&A, 682, A161 [NASA ADS] [CrossRef] [EDP Sciences] [Google Scholar]
- Spitzer, L., Jr., & Jenkins, E. B. 1975, ARA&A, 13, 133 [Google Scholar]
- Spitzer, L., Jr., Cochran, W. D., & Hirshfeld, A. 1974, ApJS, 28, 373 [Google Scholar]
- Valdivia, V., Hennebelle, P., Gérin, M., & Lesaffre, P. 2016, A&A, 587, A76 [NASA ADS] [CrossRef] [EDP Sciences] [Google Scholar]
- Wakker, B. P. 2006, ApJS, 163, 282 [Google Scholar]
- Wolfire, M. G., McKee, C. F., Hollenbach, D., & Tielens, A. 2003, ApJ, 587, 278 [CrossRef] [Google Scholar]
See the latest JWST technical report for details.
While the pipeline corrects for dark current offsets in the dark count rate it cannot compensate for changes in the coherent pattern noise.
We note that two lines of sight have H2 column densities above 1022 cm−2. Those lie at Galactic latitudes |b| below ∼0.5° and intersect the full column of Galactic disk material, similarly to the line of sight analyzed by Falgarone et al. (2005).
Appendix A Spectra and integrated intensities
Appendix A.1 Spectral features
As shown by Rigby et al. (2023), MRS background spectra include several structured emission components: the thermal emission from the telescope, which dominates above 15 µm; the zodiacal light, which dominates below 15 µm; and the stray light, which becomes significant below 5 µm. We searched for H2 emission on top of this structured continuum and instrumental features, and above the instrument noise, which increases significantly near the edges of the spectral bands (below 7 and above 27 µm).
As an illustration, we display in Fig. A.1 a representative background spectrum observed in all four MRS IFU channels, along with zoomed-in panels centered on each H2 pure rotational line. The continuum emission is subtracted by applying a sliding median filter with sigma clipping, using a kernel width of 20 spectral resolution elements. Galactic H2 lines are searched for by performing Gaussian fits over a velocity range of 600 km s−1 around the corresponding rest frequencies of each transition. The S(1) and S(2) lines are considered detected when their integrated intensities and maximum amplitude exceed the 3σ level, where the uncertainties σ are estimated from the standard deviation of the continuum-subtracted spectrum. Higher-J rotational lines are considered detected if their integrated intensities and maximum amplitude exceed 3σ and if at least one of the S(1) or S(2) lines is detected. Due to the strong instrumental noise beyond 27 µm (Argyriou et al. 2023), the 0-0 S(0) line of H2 is not included in our analysis.
Appendix A.2 Line intensities
A subset of the lines of sight retrieved from the MAST archive, together with the integrated intensities of all detected H2 lines and their associated uncertainties, is presented in Table A.1. The full version of the table is available online at the Centre de Données astronomiques de Strasbourg (CDS). The sample covers a broad region of the sky, spanning all Galactic longitudes and latitudes (see Fig. 1). Because the background observations originate from programs targeting sources with widely varying luminosities, the exposure times span a large range, from a few tens of seconds up to 46 minutes.
All pure rotational lines from S(1) to S(7) are detected at least once across the full observational sample. As described in Sect. 2.2 and detailed in Appendix B.3, selection criteria based on the total hydrogen column density and the average dust temperature are applied to identify lines of sight intersecting dense and strongly irradiated material possibly associated with star-forming complexes. When these flagged observations are excluded, the S(6) line is no longer detected.
Appendix A.3 Detection statistics
Not all lines of sight were observed in every MRS IFU channel. The dataset presented in Table A.1 is therefore incomplete. The distribution of channel coverage across the sample is summarized in Table A.2, which also provides detection statistics for each H2 pure rotational line. Restricting the analysis to diffuse lines of sight, the 0–0 S(1) line of H2 is detected along 84 lines of sight, corresponding to a detection rate of 41%. The detection rate decreases steadily for higher-energy rotational transitions, with a few detections reported for the S(4), S(5), and S(7) lines. This trend reflects both the decreasing intrinsic brightness of higher-J transitions and the limited sensitivity of the background observations.
Appendix A.4 Conversion to column densities
Interpreting the observed H2 emission and performing comparisons with ancillary data derived from absorption studies requires converting integrated line intensities into column densities, and vice versa. Assuming optically thin emission, the integrated intensity of a transition, Iul, can be converted into the column density of the upper level, Nu, according to
 (A.1)
(A.1)
where Aul and νul are the Einstein coefficient and frequency of the transition, respectively, and h is the Planck constant. This approximation is valid provided that self-absorption by H2 and absorption by PAHs can be neglected.
Because most of the H2 column density resides in the J = 0 and J = 1 levels in the diffuse ISM, only the S(1) transition can potentially be affected by self-absorption among the pure rotational lines considered here. Using a lower-bound estimate for the line width of 1 km s−1, the peak opacity of the S(1) line remains below 0.1 as long as N(H2) ≲ 1023 cm−2.
Absorption by PAHs can be estimated using conservative assumptions. Approximating PAHs as planar graphene flakes with a representative size of 6.4 Å (Compiègne et al. 2011) yields ∼ 50 carbon atoms per PAH, based on the graphene lattice geometry (Castro Neto et al. 2009). For a PAH mass fraction relative to dust of 4.6% in the diffuse ISM (Draine & Li 2007) and a dust-to-gas mass ratio of 1%, the PAH abundance relative to hydrogen is xPAH ∼ 10−6. Using an upper-bound estimate of the absorption cross section per PAH over the MIRI wavelength range of 10−18 cm2 (Draine & Li 2007), PAH absorption therefore remains negligible, with an optical depth below 0.1, as long as the total hydrogen column density NH ≲ 1023 cm−2.
As shown in Appendix B (Table B.1), both conditions, for negligible H2 self-absorption and negligible PAH absorption, are satisfied throughout our sample, except for the flagged lines of sight (see Sect. 2.2 and Appendix B.3). Throughout this paper, we therefore use intensity and upper-level column density interchangeably, enabling direct comparisons with absorption measurements and the construction of excitation diagrams (see Sect. 3).
Appendix B Estimates of gas and dust properties
Appendix B.1 All-sky surveys
The intensities of the pure rotational lines of H2 measured along the lines of sight listed in Table A.1 arise from Galactic material, with systemic velocities and associated uncertainties consistent with the range expected from Galactic rotation. To interpret the origin and excitation properties of this emission, it is therefore essential to estimate the associated gas column densities and dust emission along the same lines of sight. These ancillary quantities provide important contextual information.
To this end, we compiled estimates of the atomic hydrogen column density, N(H), the total hydrogen column density, NH, the PAH specific intensity at 12 µm, Bν(12 µm), and the average dust temperature, Tdust, using publicly available all-sky surveys from HI4PI, Planck, and WISE (HI4PI Collaboration 2016; Planck Collaboration XI 2014; Meisner & Finkbeiner 2014). Previous combined analyses of HI, dust, and CO emission across the Galaxy have shown that NH and the dust opacity at 353 GHz, τ353, can be approximated by two distinct linear relations below and above NH ≃ 6 × 1020 cm−2 (Planck Collaboration XI 2014). Following these studies, the total hydrogen column density is computed as
 (B.1)
(B.1)
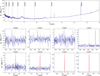 |
Fig. A.1 Example of a MRS background spectrum observed at Galactic coordinates l, b = 12.881°, 0.518° (Program ID: 01290, Observation ID: 078). Top panel: Observed specific intensity as a function of wavelength, after stitching the channel-specific spectra. Bottom panels: Continuum-subtracted intensity in zoomed-in windows centered on each H2 rotational line. Detected lines are highlighted in red. |
The resulting values of N(H), NH, τ353, Bν(12 µm), and Tdust for each line of sight are listed in Table B.1.
A key limitation of this approach lies in the spatial resolution mismatch between the ancillary all-sky surveys and the JWST/MRS observations. The angular resolution of the HI4PI data product used in this paper is 16.2’, while that of the dust and infrared maps from Planck and WISE is ∼ 5’. In contrast, the MRS instrument aboard the JWST provides effective FoVs between 6" and 12" depending on the IFU channel (see Sect. 2.1). As a result, the derived column densities and infrared specific intensities represent large-scale averages that may not capture small-scale structure or fluctuations within the MRS FoV. These quantities should therefore be interpreted as coarse contextual estimates rather than precise measurements of the conditions at the exact location of the H2 emission.
Appendix B.2 Molecular fraction
Bearing this caveat in mind, the molecular hydrogen column density along each line of sight is estimated by subtracting the atomic hydrogen contribution from the total hydrogen column density:
 (B.2)
(B.2)
This approach relies on the assumption that fully ionized phases do not contribute significantly to dust extinction, so that the column density derived from dust primarily traces neutral atomic and molecular gas. Because N(H) and NH are often comparable along the lines of sight studied in this paper—particularly at high Galactic latitude—this procedure frequently yields negative values of N(H2), reflecting the fact that the molecular component lies within the combined uncertainties of the two quantities. This behavior has been reported in previous studies (e.g., Skalidis et al. 2024). Given the uncertainties on both N(H) and, more critically, on the calibration used to derive NH, we estimate that N(H2) cannot be robustly constrained below about 10% of the total hydrogen column density. However, because the sensitivity of the MRS limits detections to relatively high molecular hydrogen column densities, the majority of lines of sight with detected H2 emission lie above this threshold.
Subset of the full catalog of background observations retrieved from the MAST archive and associated measured integrated intensities of H2 pure rotational lines.
The derived column densities of atomic and molecular hydrogen, the corresponding averaged molecular fraction
 (B.3)
(B.3)
and the PAH and dust specific intensities, span more than four orders of magnitude across the full observational sample. With the exception of a few flagged lines of sight (see Appendix B.3 and Table B.1), both NH and N(H2) remain below 1023 cm−2, thereby validating the optically thin approximation and the omission of dust extinction adopted in Eq. A.1 to convert intensities into upper-level column densities.
Appendix B.3 Selection of diffuse lines of sight
Not all MRS background observations retrieved from the MAST archive probe purely diffuse interstellar gas. A subset of lines of sight shows enhanced H2 rotational emission or elevated dust temperatures, indicative of contributions from irradiated environments such as star-forming complexes or from denser, possibly self-gravitating structures. To isolate sightlines representative of the diffuse ISM, additional selection criteria are required.
Figure B.1 shows the distributions of the logarithm of the total hydrogen column density projected perpendicular to the Galactic plane,
 (B.4)
(B.4)
and of the line-of-sight–averaged dust temperature, Tdust. The bulk of the sample is distributed in approximately symmetric cores centered around  and Tdust ≃ 20 K, characteristic of diffuse Galactic gas (Miville-Deschênes et al. 2017; Planck Collaboration XI 2014). A smaller fraction of the lines of sight extends toward higher values of both quantities, forming asymmetric wings indicative of denser or more strongly irradiated environments. We therefore classify as non-diffuse all lines of sight lying more than three standard deviations from the core of either distribution, corresponding to
  or Tdust > 25 K.
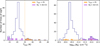 |
Fig. B.1 Integrated properties of the observational sample. Left panel: Distribution of the line-of-sight–averaged dust temperature, Tdust. Right panel: Distribution of the logarithm of the total hydrogen column density projected perpendicular to the Galactic plane, |


After excluding these flagged data, the H2 column densities associated with detected rotational lines are typically above 1019 cm−2, corresponding to molecular fractions between 0.1 and 1. This indicates that most retained lines of sight have undergone the H–H2 transition. Compared to absorption studies in the solar neighborhood, our sample occupies the higher end of the column density and molecular fraction distributions, more representative of sightlines in or near the Galactic plane (Shull et al. 2021). This reflects the sensitivity threshold of the MRS instrument, which favors the detection of diffuse regions with relatively high molecular content.
All Tables
Subset of the full catalog of background observations retrieved from the MAST archive and associated measured integrated intensities of H2 pure rotational lines.
All Figures
|
Fig. 1 Aitoff projection of the MRS background lines of sight analyzed in this paper. Filled circles indicate detections of the 0–0 S(1) line of H2, color-coded by integrated intensity, while triangles show non-detections. All lines of sight are overlaid on the total hydrogen column density map derived from the dust opacity at 353 GHz measured by Planck (Planck Collaboration XI 2014). |
| In the text | |
|
Fig. 2 Integrated intensities of the 0–0 S(1) line of H2 as a function of the absolute Galactic latitude, |b|. Green squares and blue stars correspond to values inferred from absorption measurements toward extragalactic targets and nearby OB stars observed with FUSE (Wakker 2006; Shull et al. 2021), using Eq. (A.1) and the column densities of the J = 3 rotational level. Yellow triangles show measurements obtained with Spitzer by Ingalls et al. (2011). Gray and red points represent intensities measured along flagged and un-flagged MRS background lines of sight, respectively, while red arrows indicate upper limits set by the sensitivity of the MRS over the wide range of exposure times in the sample. The dashed line shows a geometrically motivated analytical estimate of the maximum expected emission (Eq. (1)). |
| In the text | |
|
Fig. 3 Excitation diagrams of H2 derived along the MRS background lines of sight, excluding the flagged data. The column densities of each rotational level are derived from the corresponding line intensities using Eq. (A.1) and are normalized and color-coded by the H2 column density estimated in Appendix B. For visual clarity, data points are slightly offset along the energy axis by small random values. Detections, along a given line of sight, of all successive rotational transitions up to at least the S(3) line are connected by segments. |
| In the text | |
|
Fig. 4 Excitation temperature T34 between the J = 3 and J = 4 levels as a function of the excitation temperature T35 between the J = 3 and J = 5 levels. Green squares and blue stars correspond to values inferred from absorption measurements toward extragalactic targets and nearby OB stars observed with FUSE (Wakker 2006; Shull et al. 2021). Red points and arrows show measurements and upper limits, respectively, obtained along MRS background lines of sight after excluding flagged data. The dashed black line shows a power-law relation derived between the two temperatures (Eq. (2)), and the shaded region is an envelope obtained by varying each fit parameter independently within its marginalized ±3σ uncertainty, which encloses 78% of the data points. |
| In the text | |
|
Fig. 5 Flux of the 0–0 S(1) line of H2 as a function of the total hydrogen column density, NH (Table B.1). Filled squares correspond to values inferred from absorption measurements toward extragalactic targets observed with FUSE (Wakker 2006). Filled circles show intensities measured along MRS background lines of sight after excluding flagged data. Points are color-coded by the ratio of the S(1) integrated intensity to the PAH surface brightness at 12 µm measured by WISE (Table B.1). The three dotted gray lines indicate constant values of the S(1) cooling rate per hydrogen atom. The dashed red line shows a fit to the S(1) cooling rate derived from the MRS sample only (Eq. (3)). |
| In the text | |
|
Fig. A.1 Example of a MRS background spectrum observed at Galactic coordinates l, b = 12.881°, 0.518° (Program ID: 01290, Observation ID: 078). Top panel: Observed specific intensity as a function of wavelength, after stitching the channel-specific spectra. Bottom panels: Continuum-subtracted intensity in zoomed-in windows centered on each H2 rotational line. Detected lines are highlighted in red. |
| In the text | |
|
Fig. B.1 Integrated properties of the observational sample. Left panel: Distribution of the line-of-sight–averaged dust temperature, Tdust. Right panel: Distribution of the logarithm of the total hydrogen column density projected perpendicular to the Galactic plane, |
| In the text | |
Current usage metrics show cumulative count of Article Views (full-text article views including HTML views, PDF and ePub downloads, according to the available data) and Abstracts Views on Vision4Press platform.
Data correspond to usage on the plateform after 2015. The current usage metrics is available 48-96 hours after online publication and is updated daily on week days.
Initial download of the metrics may take a while.