Fig. 2
Download original image
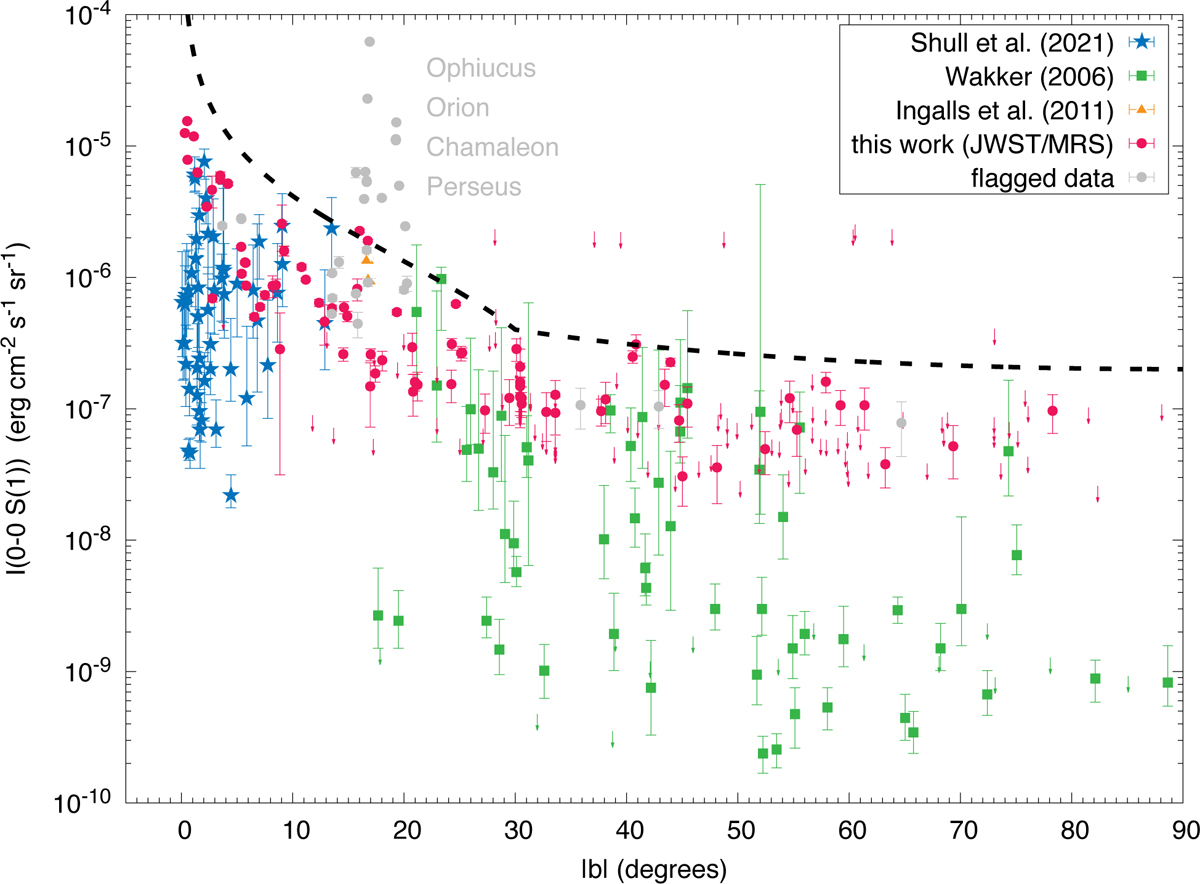
Integrated intensities of the 0–0 S(1) line of H2 as a function of the absolute Galactic latitude, |b|. Green squares and blue stars correspond to values inferred from absorption measurements toward extragalactic targets and nearby OB stars observed with FUSE (Wakker 2006; Shull et al. 2021), using Eq. (A.1) and the column densities of the J = 3 rotational level. Yellow triangles show measurements obtained with Spitzer by Ingalls et al. (2011). Gray and red points represent intensities measured along flagged and un-flagged MRS background lines of sight, respectively, while red arrows indicate upper limits set by the sensitivity of the MRS over the wide range of exposure times in the sample. The dashed line shows a geometrically motivated analytical estimate of the maximum expected emission (Eq. (1)).
Current usage metrics show cumulative count of Article Views (full-text article views including HTML views, PDF and ePub downloads, according to the available data) and Abstracts Views on Vision4Press platform.
Data correspond to usage on the plateform after 2015. The current usage metrics is available 48-96 hours after online publication and is updated daily on week days.
Initial download of the metrics may take a while.