Fig. 4
Download original image
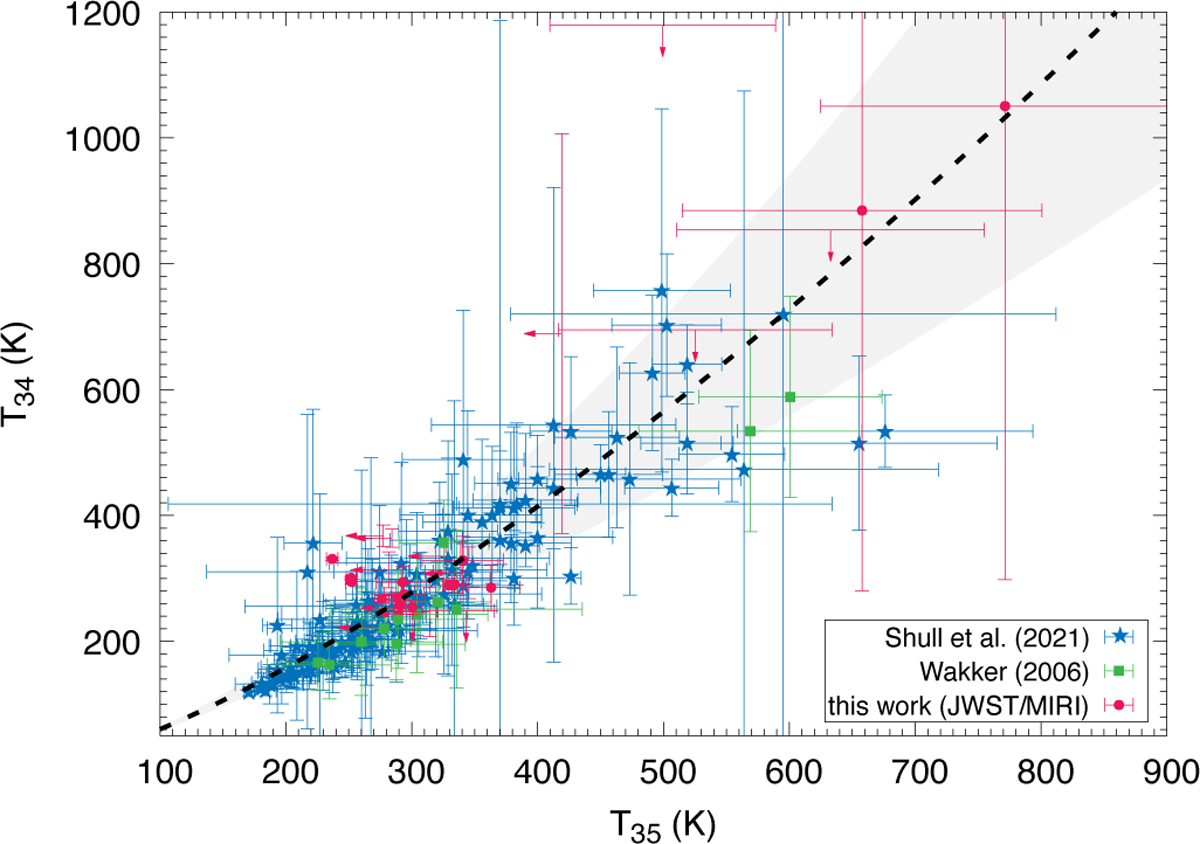
Excitation temperature T34 between the J = 3 and J = 4 levels as a function of the excitation temperature T35 between the J = 3 and J = 5 levels. Green squares and blue stars correspond to values inferred from absorption measurements toward extragalactic targets and nearby OB stars observed with FUSE (Wakker 2006; Shull et al. 2021). Red points and arrows show measurements and upper limits, respectively, obtained along MRS background lines of sight after excluding flagged data. The dashed black line shows a power-law relation derived between the two temperatures (Eq. (2)), and the shaded region is an envelope obtained by varying each fit parameter independently within its marginalized ±3σ uncertainty, which encloses 78% of the data points.
Current usage metrics show cumulative count of Article Views (full-text article views including HTML views, PDF and ePub downloads, according to the available data) and Abstracts Views on Vision4Press platform.
Data correspond to usage on the plateform after 2015. The current usage metrics is available 48-96 hours after online publication and is updated daily on week days.
Initial download of the metrics may take a while.