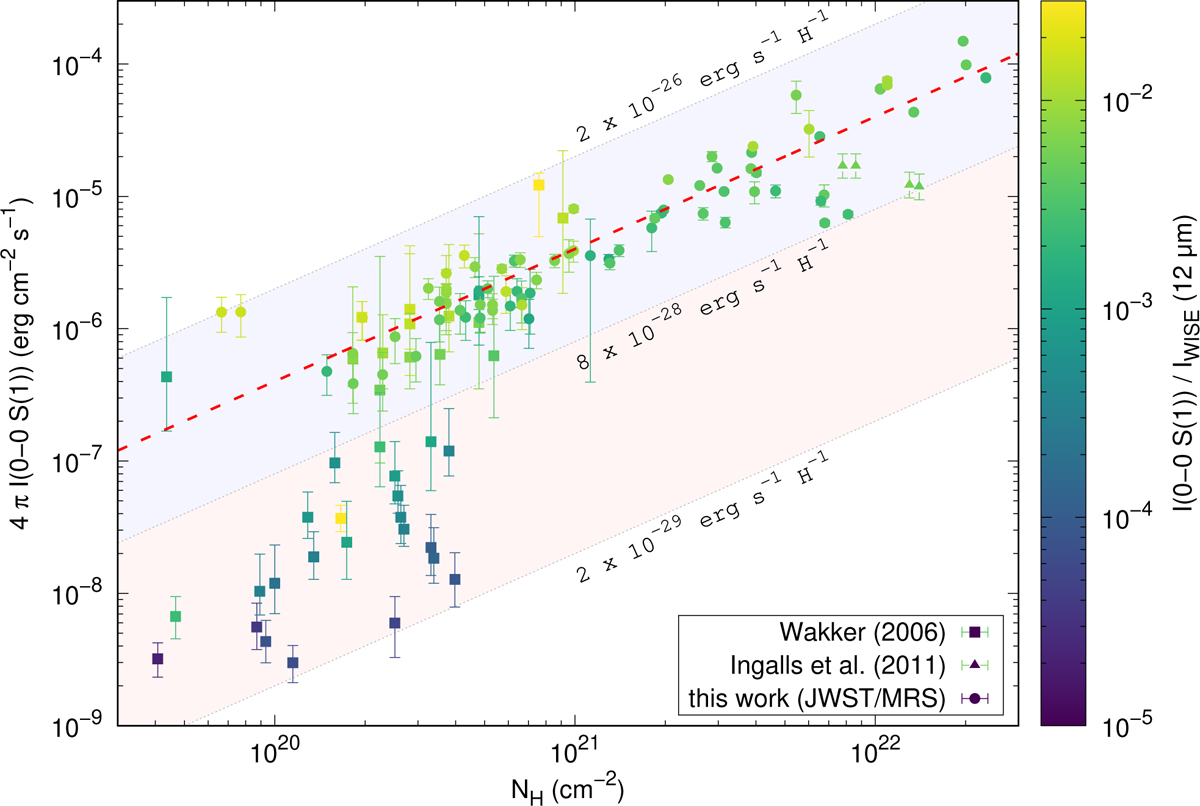
Fig. 5
Download original image
Flux of the 0–0 S(1) line of H2 as a function of the total hydrogen column density, NH (Table B.1). Filled squares correspond to values inferred from absorption measurements toward extragalactic targets observed with FUSE (Wakker 2006). Filled circles show intensities measured along MRS background lines of sight after excluding flagged data. Points are color-coded by the ratio of the S(1) integrated intensity to the PAH surface brightness at 12 µm measured by WISE (Table B.1). The three dotted gray lines indicate constant values of the S(1) cooling rate per hydrogen atom. The dashed red line shows a fit to the S(1) cooling rate derived from the MRS sample only (Eq. (3)).
Current usage metrics show cumulative count of Article Views (full-text article views including HTML views, PDF and ePub downloads, according to the available data) and Abstracts Views on Vision4Press platform.
Data correspond to usage on the plateform after 2015. The current usage metrics is available 48-96 hours after online publication and is updated daily on week days.
Initial download of the metrics may take a while.