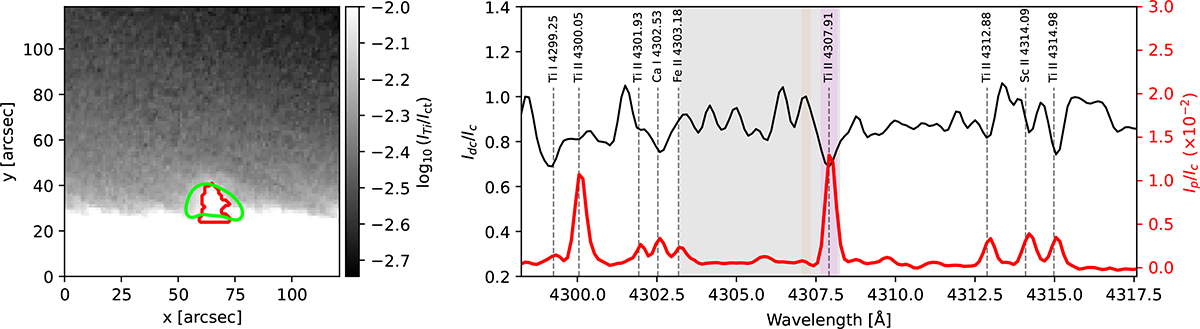
Fig. 2.
Download original image
Overview of prominence 1A observations. Left: Prominence 1A imaged in the Ti II 4307.9 Å line (violet line in the right plot) shown in grayscale after the nearby continuum was subtracted (tan line in the right plot). The green contour represents the extent of the prominence in a GONG Hα filtergram. Right: Disk center profile (black) showing the spectral extent of the recording, along with the prominence spectrum (red) after normalization to the disk center continuum intensity. The nine brightest emission lines are marked with dashed vertical lines. The gray shaded region corresponds to the spectral FaMuLUS window.
Current usage metrics show cumulative count of Article Views (full-text article views including HTML views, PDF and ePub downloads, according to the available data) and Abstracts Views on Vision4Press platform.
Data correspond to usage on the plateform after 2015. The current usage metrics is available 48-96 hours after online publication and is updated daily on week days.
Initial download of the metrics may take a while.