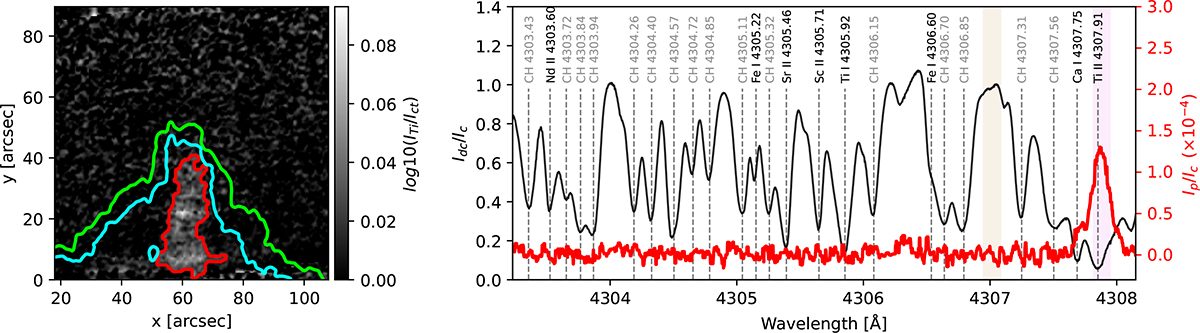
Fig. 4.
Download original image
Overview of prominence 2 observations. Left: Prominence 2 imaged in the Ti II line at 4307.91 Å (violet band in the right panel), shown in grayscale as a logarithmic contrast plot with the nearby continuum (tan band in right panel). The green contour indicates the extent of the prominence in an Hα slit-reconstructed line-core intensity map, the cyan contour traces the prominence extent in a Ca II NIR slit-reconstructed line-core intensity map, and the red contour marks the prominence extent of the slit-reconstructed intensity map at 4307.91 Å. Right: Disk-center profile (black) showing the spectral extent of the recording, along with the prominence spectrum (red) after background subtraction. The line identifications are denoted with dashed vertical lines, black for atoms, and gray for CH.
Current usage metrics show cumulative count of Article Views (full-text article views including HTML views, PDF and ePub downloads, according to the available data) and Abstracts Views on Vision4Press platform.
Data correspond to usage on the plateform after 2015. The current usage metrics is available 48-96 hours after online publication and is updated daily on week days.
Initial download of the metrics may take a while.