Fig. 5.
Download original image
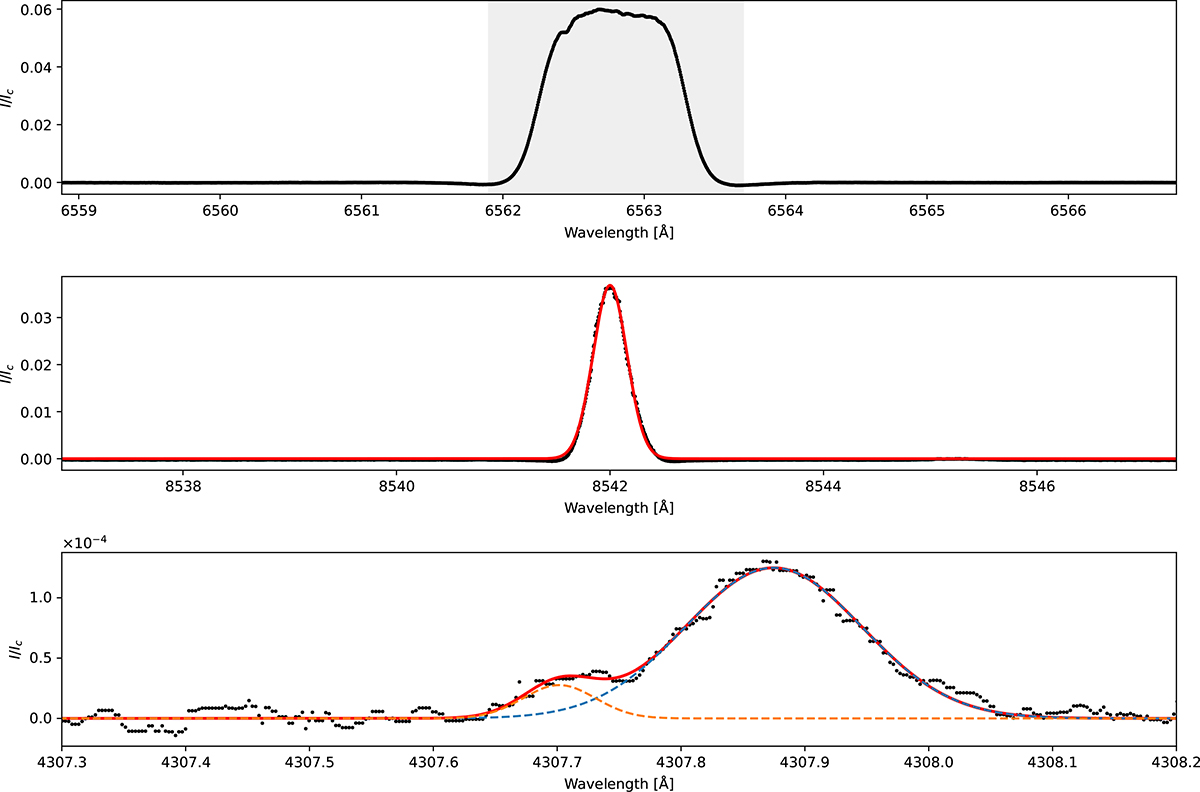
Processed prominence signals in the Hα line, the Ca II line, and the Ca I and Ti II line pair of the G-band, normalized to the local disk-center intensity. For the first row, a sum (gray box) is taken over the non-Gaussian emission profile to obtain the integrated line intensity of the prominence. A Gaussian was fit to the emission of the other two prominences. The best-fit parameters of these Gaussians are given in Table 1.
Current usage metrics show cumulative count of Article Views (full-text article views including HTML views, PDF and ePub downloads, according to the available data) and Abstracts Views on Vision4Press platform.
Data correspond to usage on the plateform after 2015. The current usage metrics is available 48-96 hours after online publication and is updated daily on week days.
Initial download of the metrics may take a while.