Fig. 1.
Download original image
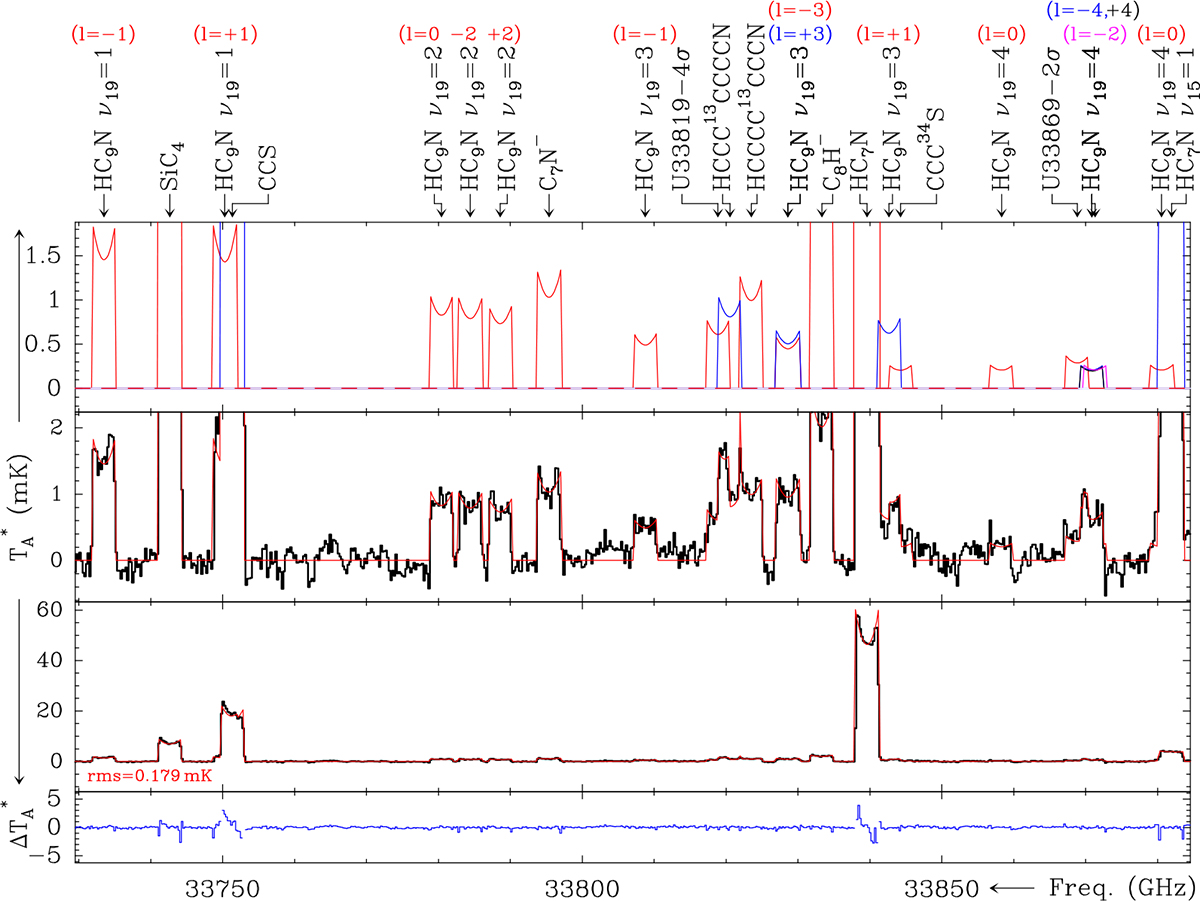
Example of line identification, decomposition, and fitting of our Q-Band IRC+10216 spectrum around Jup = 58 for several HC9N ν19 vibrational states (1,2,3,4) found in this work. The top panel shows individual line contributions (several colors are used to distinguish them if necessary), middle panels show the resulting combination on top of the data, and the lower panel shows fit residuals.
Current usage metrics show cumulative count of Article Views (full-text article views including HTML views, PDF and ePub downloads, according to the available data) and Abstracts Views on Vision4Press platform.
Data correspond to usage on the plateform after 2015. The current usage metrics is available 48-96 hours after online publication and is updated daily on week days.
Initial download of the metrics may take a while.