| Issue |
A&A
Volume 709, May 2026
|
|
|---|---|---|
| Article Number | L13 | |
| Number of page(s) | 4 | |
| Section | Letters to the Editor | |
| DOI | https://doi.org/10.1051/0004-6361/202659372 | |
| Published online | 12 May 2026 | |
Letter to the Editor
Discovery of HC9N ν19 overtones in IRC+10216
1
Departamento de Astrofísica Molecular, Instituto de Física Fundamental (IFF-CSIC), Calle Serrano 121, 28006 Madrid, Spain
2
Centre National de la Recherche Scientifique, Observatoire de Paris, LIRA, 77 Avenue Denfert Rochereau, 75014 Paris, France
3
Centro de Desarrollos Tecnológicos, Observatorio de Yebes (IGN), 19141 Yebes, Guadalajara, Spain
4
Observatorio Astronómico Nacional (OAN, IGN), Calle Alfonso XII 3, 28014 Madrid, Spain
5
Institut de Radioastronomie Millimétrique, 300 rue de la Piscine, F-38406 Saint Martin d’Hères, France
★ Corresponding authors: This email address is being protected from spambots. You need JavaScript enabled to view it.
; This email address is being protected from spambots. You need JavaScript enabled to view it.
Received:
7
February
2026
Accepted:
18
March
2026
Abstract
The sub-milliKelvin sensitivity achieved in the Q-band (31–50 GHz) line survey of IRC+10216 obtained with the Yebes 40m telescope reveals the presence of several new vibrational HC9N overtones (ν19 ≥ 2) beyond the already reported ν19 = 1. The newly found series of rotational lines appears in seven groups with rotational constants (B) between 291.252 and 293.465 MHz, with integer quantum numbers from Jup = 54 to 81 and upper-level excitation energies up to ∼600 K, well above what is typical of lines found in the outer part of this circumstellar envelope. All evidence, especially the spectral splitting of the ℓ-doubling components and the spacing between B values, unambiguously points toward rotational lines within ν19 = 2 − 8 that appear surprisingly strong, possibly due to very efficient infrared pumping and slow decay via the ν19 mode. The detection of ν19 = 5, 6, 7, and 8 has been possible thanks to collapsed ℓ-doubling components to a single or only two spectral features per rotational transition. To obtain a correct determination of the abundance of HC9N in IRC+10216 one has to take into account that about ∼70% is estimated to be in the vibrationally excited ν19 states.
Key words: line: identification / molecular data / stars: carbon / circumstellar matter / stars: individual: IRC+10216
© The Authors 2026
 Open Access article, published by EDP Sciences, under the terms of the Creative Commons Attribution License (https://creativecommons.org/licenses/by/4.0), which permits unrestricted use, distribution, and reproduction in any medium, provided the original work is properly cited.
This article is published in open access under the Subscribe to Open model. This email address is being protected from spambots. You need JavaScript enabled to view it. to support open access publication.
1. Introduction
One of the main scientific outputs of the ERC synergy project NANOCOSMOS has been an ultra-sensitive Q-band integration on IRC+10216. After a first overall publication presenting spectra accumulated toward this source from May 2019 to February 2020 with the Yebes-40m telescope (Pardo et al. 2022), other specific papers soon followed based on either the same dataset or partial extensions of it completed before 2024 (Pardo et al. 2020, 2021; Changala et al. 2022; Cernicharo et al. 2023a,b; Cabezas et al. 2023). At present, observations have been added until September 2024 with improvements in the receivers, resulting in better system temperatures. The sub-milliKelvin sensitivity in the antenna temperature has led to new findings on the great chemical richness of IRC+10216 (Massalkhi et al. 2024; Gupta et al. 2024; Pardo et al. 2025; Cernicharo et al. 2025).
Several vibrational states of cyanopolyynes have been detected in IRC+10216, including ν19 = 1 (Pardo et al. 2020, hereafter P20, and references therein). With this in mind, we have kept our attention on the possible appearance of more energetic ν19 overtones and other bending modes of cyanopolyynes as the sensitivity of the IRC+10216 survey increased.
In this work we present the discovery of rotational ladders in previously unreported ν19 = 2 − 8 bending overtones of HC9N toward IRC+10216. The data are interpreted in terms of infrared pumping of the vibrational levels of the molecule. We performed a systematic search for all possible bending modes of this species, but only the lowest ν19 = 1 and its overtones were detected. Rotational, distortion, and vibration-rotational spectroscopic constants have been derived for all of these overtones.
2. Observations and analysis
Our recent publication Pardo et al. (2025), hereafter P25, provides the basic information about the observational procedures, technical setup (see also, Tercero et al. 2021), calibration, data accumulation, and reduction. In summary, we achieved 1360 hours of on-source telescope time in 480 observing sessions from April 2019 to September 2024 with the antenna main beam efficiency ranging from 0.60 (31 GHz) to 0.43 (50 GHz); a beam size of 45” at 39.2 GHz; detection through two HEMT cold amplifiers covering the 31.0–50.3 GHz range; 16 × 2.5 GHz fast Fourier transform spectrometers used as backends, with a primary spectral resolution of 38.1 kHz (smoothed to 229 kHz for the final data set); and observing mode in position switching, with an off position at 300″ in azimuth. Pointing errors were within 2–3″ and calibration uncertainties within 10%. The global fit strategy using a characteristic line profile for IRC+10216 is described in Section 3 of P25. The experimental results are the integrated areas and the central line frequencies of each individual line returned by a short-iterative process. The horn-to-center intensity ratio, H, from Equation (1) in P25 was kept constant and equal to 0.3 for all lines of interest in this work (other values may apply for lines not important here). With the derived, or fixed in cases of strong blending or poor signal-to-noise ratio (S/N), individual line areas shown in Figure 1, we produced a complete fit spectrum along with rotational diagrams for each relevant spectroscopic species (molecule, isotopolog, vibrational mode). Examining these diagrams allowed us to identify and correct obviously wrong areas of some blended lines, thus improving the final fit spectrum.
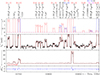 |
Fig. 1. Example of line identification, decomposition, and fitting of our Q-Band IRC+10216 spectrum around Jup = 58 for several HC9N ν19 vibrational states (1,2,3,4) found in this work. The top panel shows individual line contributions (several colors are used to distinguish them if necessary), middle panels show the resulting combination on top of the data, and the lower panel shows fit residuals. |
3. Results
For systematic exploration of the data, we used the method described by Cernicharo et al. (2024), which consists of modified Loomis-Wood diagrams (Loomis & Wood 1928). This approach allowed us to explore the data and identify new series of lines that could be assigned to new molecules or to isotopologs and/or vibrationally excited states of known molecules. In each vibrational overtone, ν19=n, each rotational level J has n+1 ℓ-doubling components (ℓ from –n to n by steps of 2). Selection rules are ΔJ = ±1. For ℓ≠0, transitions with ΔJ = 0 are also allowed (ℓ-doubling transitions). The detection of doublets corresponding to ν19 = 1 (ℓ = ±1) was published in P20. Evidence of spectroscopic features compatible with higher ν19 states quickly appeared. The ν19 = 2 level emerged as a triplet of lines corresponding to ℓ = 0, +2, and –2, which are clearly visible in the current dataset (see Fig. 1). With the increase of n, it could be expected that the detectability would rapidly fade as a combination of the higher-level energies and the dispersion of the signal over an increasing number of ℓ-doubling components. However, two facts favor the detection of higher ν19 overtones: IR pumping plays a role in favoring the population of higher vibrational levels, and some ℓ-doubling components collapse to a single feature. In practice, ν19 = 3 rotational lines appear as triplets, instead of quartets, because the ℓ = ±3 are closely blended. The same happens with ℓ = ±4 and –2 in ν19 = 4. Therefore, we detected a single slightly broadened spectral feature for each J and two separated and weaker features corresponding to ℓ = 0 and +2. For n = 5, the components with very close frequencies are ℓ = ±5 and ℓ = ±3, and we detected an overlapped doublet. Finally, within n = 6, the components of the ℓ = ±6 and ℓ = ±4 pairs have each very similar frequencies, and we detected a tighter (compared to n = 5) overlapped doublet. In the spectral fitting procedure, every single component is entered separately but fit together with its pair. For ν19 = 7, 8 only one observed feature per J transition can be assigned to them. We believe that for ν19 = 7 we observed four lines at nearly the same frequency corresponding to ℓ = ±5 and ℓ = ±7, and we have assigned one-fourth of the observed area to each one. Similarly, for ν19 = 8 the observed features could correspond to a blend of ℓ = ±6 and ±8, and the observed area would be split equally among the four. Other ℓ components would be separated in frequency, and therefore, their individual intensity would be too weak for detection.
In order to derive spectroscopic constants (see below) for each ν19 overtone, we used a fitting program based on the formalism developed for vibrationally excited bending modes of linear molecules by Yamada et al. (1985) (see also Okabayashi et al. 1999). The fit values were then implemented in MADEX (Cernicharo 2012) to predict the rotational spectroscopy of the overtone. The spectroscopic constants B, D, XL, and DJℓ in Table 1 correspond to the diagonal contributions to the rotational energy from the rotation and the bending movements, while all the remaining parameters (q and ρ) represent non-diagonal contributions of the bending to the vibration-rotation Hamiltonian. The αn vibrational constant describes the regular increase in B from one ν19 overtone to the next. It is derived as [B(ν19 = n)-B(ν19 = 0)]/n and has an average (giving equal weight to all values) of 0.3682(2) MHz, which is in very good agreement with the value calculated theoretically (∼0.35 MHz, P20). This gives further support to the identification of the rotational ladders as belonging to ν19 overtones. Within the uncertainties, the ℓ-doubling constant q is practically the same, 0.1461(1) MHz, for all vibrational states showing lines with different ℓ components (i.e., from ν19 = 1 to 6). This is in excellent agreement with our previous theoretical calculations (∼0.14 MHz, P20). For ν19 = 7, 8 only the rotational constant B could be fit.
Spectroscopic constants (first seven rows) and physical parameters (last two rows) for HC9N in the ground and eight ν19 excited states.
We have evidence of 683 rotational transitions from HC9N, even if not all of these lines are clearly seen individually due to blending between them and/or other species. They represent almost a quarter of all individual lines detected in our survey and ∼33.5% of all lines identified so far. It is obviously impossible to show all HC9N lines in figures in this Letter, so we have created the compact Figure 2 with selected spectra and the rotational diagrams including points from all observed lines.
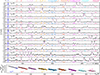 |
Fig. 2. Top 11 panels: Selected data portions (black histograms) containing HC9N rotational lines in the ground state, ν19 = 1, and seven ν19 overtones with their fit contribution highlighted in different colors over the full spectral fit (dotted magenta line shifted by –2 mK). Bottom panel: Rotational diagrams resulting from the HC9N line areas corrected for beam coupling and dilution over a 30″ source (W = ∫TMBdv). Here, μ is the HC9N electric dipole moment, and S is the quantum line strength of each transition. Filled circles are used for lines with a fit intensity, open circles are for lines with a fixed intensity (due to strong overlap or low S/N), and crosses correspond to the subset of lines actually shown in the top panels. The linear regressions use only the filled circles and provide rotational temperatures and column densities listed in Table 1. |
4. Discussion
There is clear evidence of a radiative pumping mechanism producing an overpopulation of HC9N ν19 overtones since the typical densities and temperatures of the gas in the circumstellar envelope of CW Leo cannot explain a significant population of the levels involved in the detected transitions, which are well above ∼600 K in some cases. The rotational temperatures derived from the different rotational ladders are ∼25–45 K, whereas the vibrational temperature would be around 250 K (see values in Table 1 as derived from data in the bottom panel of Figure 2). For the HC9N ground vibrational state, we can make a rough estimate by using the collisional rates in the MADEX LVG module (Bhattacharyya & Dickinson 1982) and assuming that the emitting gas is in a zone of uniform density and kinetic temperature (n(H2) = 3 × 104 cm−3, TK = 25 K, N[HC9N, ν19 = 0] = 3 × 1013 cm−2) with an expanding velocity vexp = 14.5 km s−1, from which we get values of the antenna temperature, after correcting MADEX TB outputs for the telescope’s efficiency and dilution over a 30″ source, that range from ∼5 mK for Jupp = 54 to ∼2 mK for Jupp = 79, which is in reasonable agreement with Figure 2. The rotational diagrams for the ground and the ν19 = 1 vibrational state seem to display a curvature due to the decrease of the rotational temperature with increasing J, as expected for any molecule out of local thermodynamic equilibrium, which is already predicted by the above mentioned MADEX LVG calculation. In addition, there is a varying relative contribution of the different circumstellar layers with J that impacts the data. The same effect could be present for ν19 > 1, but it is difficult to see due to a low S/N.
In Table B.4 of P20, one can see that the energies of several vibrational states (at least ν18, ν17, and ν16) are below the energy of ν19 = 6. Therefore, we should search for them. We have estimates for the spectroscopic parameters, in particular for the rotational constant B and the ℓ-type doubling constant q in Table B.1 of P20. For ν18 we should search around the range B ∼ 290.806 − 290.811 MHz (the upper value being the most possible, as it takes into account a similar correction from predicted to observed as ν19), q ∼ 0.0533 MHz, and up to ±0.3 MHz around the resulting positions for the ℓ ± 1 components to take into account a wide uncertainty range for B. The parameter q indicates that the splitting into different ℓ components would be smaller (closer in frequency) for ν18 than for ν19. The components would be closer in frequency. In summary, Figure 3 shows the most probable central positions for each component of the ν18 = 1 doublets. We did not find coincident spectral features at the given positions, or nearby, that could be related to a rotational ladder within ν18 = 1 for the entire range of the explored B. Based on the current sensitivity, the upper limit populations for ν18, 17, … = 1 is ∼1012 cm−2.
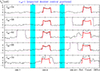 |
Fig. 3. Expected position (in light blue) for the center of the selected rotational lines within ν18 = 1, the lowest vibrational state of HC9N after ν19 = 1 (rotational doublets shown in red), for a selection of J values. |
A qualitative explanation to our data could be that HC9N absorbs IR radiation in all its stretching (10) and bending (9) modes and their combination bands, chiefly in the range λ ≃ 5 − 20 μm (see again Table B.4 of P20), where the flux from the source is especially strong and extended. This involves modes ∼ ν4 to ν14 and several combinations. The energy of some photons trapped this way ends in a ν19 ladder due to a much slower decay rate to the ground state compared to other vibrational modes. Possible (Fermi) resonances between the stretching modes with an overtone n of ν19 (or through combination bands) could produce a high population of the ν19 = n-1 mode, which is just below the n for which the resonance is produced. Looking to the predicted vibrational frequencies in P20, several cases could be possible. However, precise values of the vibrational energies are needed to make a reasonable argumentation on this mechanism. Direct excitation from the ground to high ν19 overtones via far-IR absorption, or collisions with H2, would not be efficient enough to reach states beyond ν19 = 2. A similar effect, fading with decreasing molecular size, seems to happen for shorter cyanopolyynes, as we detect rotational lines within several excited states of their lowest energy bending modes, ν15 = 1, 2, 3 (HC7N), ν11 = 1, 2 (HC5N), and ν7 = 1 (HC3N), but not for other modes. A detailed model including all unknown parameters such as ro-vibrational frequencies and radiative and collisional rates remains as a follow-up task.
It is important to point out that the detection of the new ν19 vibrational states presented here for the first time, with milliKelvin and sub-milliKelvin antenna temperatures, required several years of data accumulation. IRC+10216 has periodical IR flux variation (see, for example, Shenavrin et al. 2011 and Menten et al. 2012) with a subsequent effect on thermal rotational lines from different species that has been well reported in Cernicharo et al. (2014) and Pardo et al. (2018). The periodic variability is especially well characterized for radicals such as CN, CCH, and C4H but also, with a lower contrast, for cyanopolyynes such as HC3N and HC5N. Therefore, it would not be surprising that the newly reported rotational ladders within the ν19 vibrational overtones of HC9N would also display variability since the populations of these overtones are supposed to be tightly related to this changing IR flux. However, although our spectra span nearly five and a half years (approximately three stellar cycles), a temporal subdivision to search for variability is limited by instrumental changes, irregular temporal sampling, and the requirement to combine all data to reach sufficient sensitivity for ν19 ≥ 2. A check for the variability of rotational lines on the ground and ν19 = 1 states could be done, but this is beyond the scope of this work.
5. Conclusions
We have revealed for the first time the presence of seven new vibrationally (ν19) excited states of HC9N. However, no other vibrationally excited states (ν18, ν17…) were seen through rotational transitions. We derived the rotational constants for all of the vibrational levels that allow their rotational transitions to be predicted, which should be included in the spectral catalogs used for molecule searches in IRC+10216. A very significant fraction (up to ∼75%) of the total number of HC9N molecules in IRC+10216 are in these vibrationally excited states, which is important for the correct determination of the molecular abundances of long carbon chain molecules. We have given possible qualitative explanations for the peculiar presence of so many ν19 overtones, but a detailed study would require knowledge of radiative and collisional rates, which are unknown at the present.
Data availability
The complete list of HC9N transitions identified in this work and the full numerical data used for the bottom panel of Figure 2 are available at the CDS via https://cdsarc.cds.unistra.fr/viz-bin/cat/J/A+A/709/L13
Acknowledgments
Based on observations carried out with the Yebes 40m telescope through projects 19A010, 20A017, 20B014 and 21A019, and 23A026. The 40m radio telescope at Yebes Observatory is operated by the Spanish Geographic Institute (IGN; Ministerio de Transportes, y Movilidad Sostenible). We thank the ERC for funding support through grant ERC-2013-SyG-610256-NANOCOSMOS, and to the Spanish “Ministerio de Ciencia, Innovación y Universidades”, FEDER, ESF+ for funding support through the grants PID2020-117034RJ-I00, PID2022-137980NB-I00, PID2023-147545NB-I00, and RYC2023-045648-I (MICIU/AEI/10.13039/501100011033).
References
- Bhattacharyya, S. S., & Dickinson, A. S. 1982, A&A, 107, 26 [NASA ADS] [Google Scholar]
- Cabezas, C., Pardo, J. R., Agúndez, M., et al. 2023, A&A, 672, L12 [NASA ADS] [CrossRef] [EDP Sciences] [Google Scholar]
- Cernicharo, J. 2012, EAS Publ. Ser., 58, 251 [Google Scholar]
- Cernicharo, J., Teyssier, D., Quintana-Lacaci, G., et al. 2014, ApJ, 796, L21 [NASA ADS] [CrossRef] [Google Scholar]
- Cernicharo, J., Pardo, J. R., Cabezas, C., et al. 2023a, A&A, 670, L19 [NASA ADS] [CrossRef] [EDP Sciences] [Google Scholar]
- Cernicharo, J., Cabezas, C., Pardo, J. R., et al. 2023b, A&A, 672, L13 [NASA ADS] [CrossRef] [EDP Sciences] [Google Scholar]
- Cernicharo, J., Cabezas, C., Fuentetaja, R., et al. 2024, A&A, 690, L13 [NASA ADS] [CrossRef] [EDP Sciences] [Google Scholar]
- Cernicharo, J., Pardo, J. R., Agúndez, M., et al. 2025, A&A, 700, L20 [NASA ADS] [CrossRef] [EDP Sciences] [Google Scholar]
- Changala, P. B., Gupta, H., Cernicharo, J., et al. 2022, ApJ, 940, L42 [NASA ADS] [CrossRef] [Google Scholar]
- Gupta, H., Changala, P. B., Cernicharo, J., et al. 2024, ApJ, 966, L28 [Google Scholar]
- Loomis, F. W., & Wood, R. W. 1928, Phys. Rev., 32, 223 [NASA ADS] [CrossRef] [Google Scholar]
- Massalkhi, S., Agúndez, M., Fonfría, J. P., et al. 2024, A&A, 688, A16 [NASA ADS] [CrossRef] [EDP Sciences] [Google Scholar]
- Menten, K. M., Reid, M. J., Kamiński, T., et al. 2012, A&A, 543, A73 [NASA ADS] [CrossRef] [EDP Sciences] [Google Scholar]
- Okabayashi, T., Tanaka, K., & Tanaka, T. 1999, J. Mol. Spec., 195, 22 [Google Scholar]
- Pardo, J. R., Cernicharo, J., Velilla-Prieto, L., et al. 2018, A&A, 615, L4 [NASA ADS] [CrossRef] [EDP Sciences] [Google Scholar]
- Pardo, J. R., Bermúdez, C., Cabezas, C., et al. 2020, A&A, 640, L13 [NASA ADS] [CrossRef] [EDP Sciences] [Google Scholar]
- Pardo, J. R., Cabezas, C., Fonfría, J. P., et al. 2021, A&A, 652, L13 [NASA ADS] [CrossRef] [EDP Sciences] [Google Scholar]
- Pardo, J. R., Cernicharo, J., Tercero, B., et al. 2022, A&A, 658, A39 [NASA ADS] [CrossRef] [EDP Sciences] [Google Scholar]
- Pardo, J. R., Fonfría, J. P., Agúndez, M., et al. 2025, A&A, 700, L6 [NASA ADS] [CrossRef] [EDP Sciences] [Google Scholar]
- Shenavrin, V. I., Taranova, O. G., & Nadzhip, A. E. 2011, Astron. Rep., 55, 31 [NASA ADS] [CrossRef] [Google Scholar]
- Tercero, F., López-Pérez, J. A., Gallego, J. D., et al. 2021, A&A, 645, A37 [EDP Sciences] [Google Scholar]
- Yamada, K. M. T., Birss, F. W., & Aliev, M. R. 1985, J. Mol. Spec., 112, 347 [Google Scholar]
All Tables
Spectroscopic constants (first seven rows) and physical parameters (last two rows) for HC9N in the ground and eight ν19 excited states.
All Figures
|
Fig. 1. Example of line identification, decomposition, and fitting of our Q-Band IRC+10216 spectrum around Jup = 58 for several HC9N ν19 vibrational states (1,2,3,4) found in this work. The top panel shows individual line contributions (several colors are used to distinguish them if necessary), middle panels show the resulting combination on top of the data, and the lower panel shows fit residuals. |
| In the text | |
|
Fig. 2. Top 11 panels: Selected data portions (black histograms) containing HC9N rotational lines in the ground state, ν19 = 1, and seven ν19 overtones with their fit contribution highlighted in different colors over the full spectral fit (dotted magenta line shifted by –2 mK). Bottom panel: Rotational diagrams resulting from the HC9N line areas corrected for beam coupling and dilution over a 30″ source (W = ∫TMBdv). Here, μ is the HC9N electric dipole moment, and S is the quantum line strength of each transition. Filled circles are used for lines with a fit intensity, open circles are for lines with a fixed intensity (due to strong overlap or low S/N), and crosses correspond to the subset of lines actually shown in the top panels. The linear regressions use only the filled circles and provide rotational temperatures and column densities listed in Table 1. |
| In the text | |
|
Fig. 3. Expected position (in light blue) for the center of the selected rotational lines within ν18 = 1, the lowest vibrational state of HC9N after ν19 = 1 (rotational doublets shown in red), for a selection of J values. |
| In the text | |
Current usage metrics show cumulative count of Article Views (full-text article views including HTML views, PDF and ePub downloads, according to the available data) and Abstracts Views on Vision4Press platform.
Data correspond to usage on the plateform after 2015. The current usage metrics is available 48-96 hours after online publication and is updated daily on week days.
Initial download of the metrics may take a while.