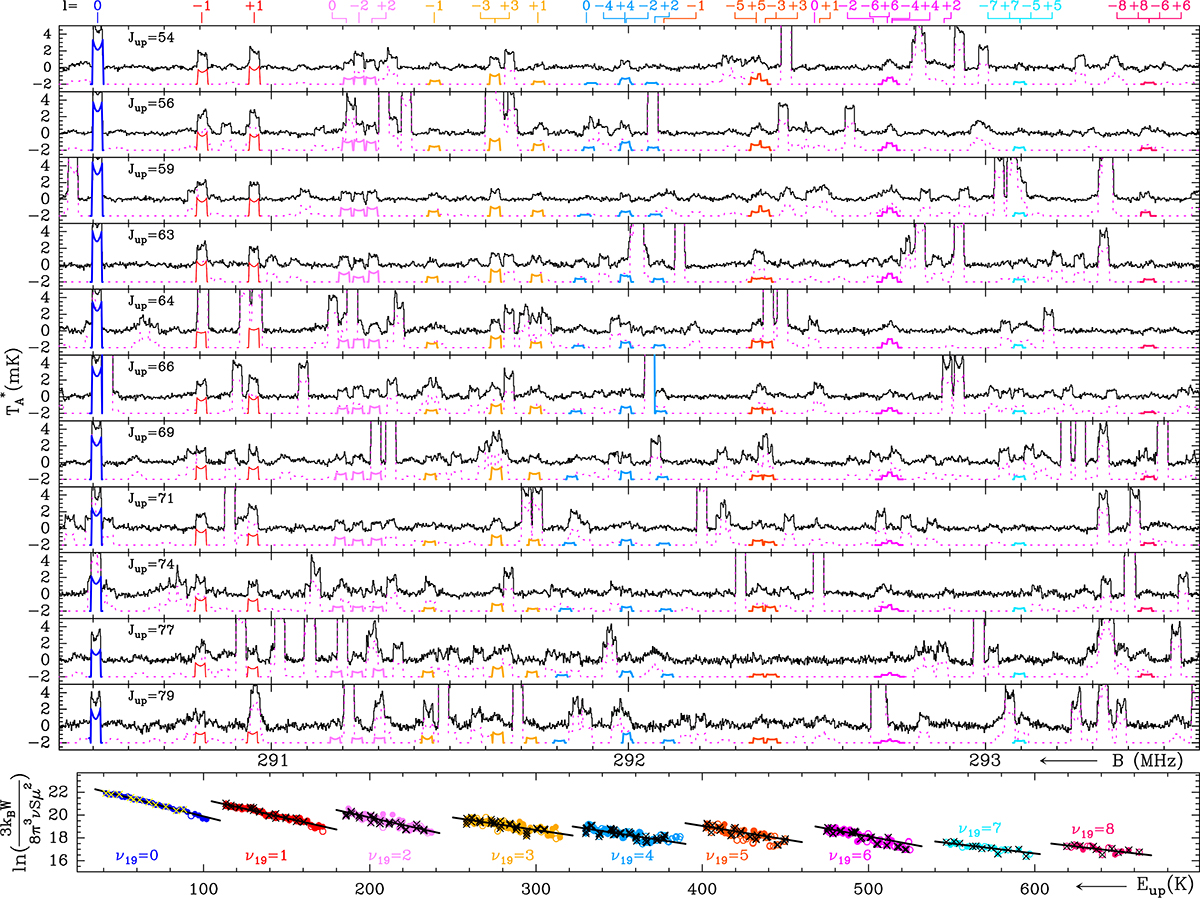
Fig. 2.
Download original image
Top 11 panels: Selected data portions (black histograms) containing HC9N rotational lines in the ground state, ν19 = 1, and seven ν19 overtones with their fit contribution highlighted in different colors over the full spectral fit (dotted magenta line shifted by –2 mK). Bottom panel: Rotational diagrams resulting from the HC9N line areas corrected for beam coupling and dilution over a 30″ source (W = ∫TMBdv). Here, μ is the HC9N electric dipole moment, and S is the quantum line strength of each transition. Filled circles are used for lines with a fit intensity, open circles are for lines with a fixed intensity (due to strong overlap or low S/N), and crosses correspond to the subset of lines actually shown in the top panels. The linear regressions use only the filled circles and provide rotational temperatures and column densities listed in Table 1.
Current usage metrics show cumulative count of Article Views (full-text article views including HTML views, PDF and ePub downloads, according to the available data) and Abstracts Views on Vision4Press platform.
Data correspond to usage on the plateform after 2015. The current usage metrics is available 48-96 hours after online publication and is updated daily on week days.
Initial download of the metrics may take a while.