Fig. 1
Download original image
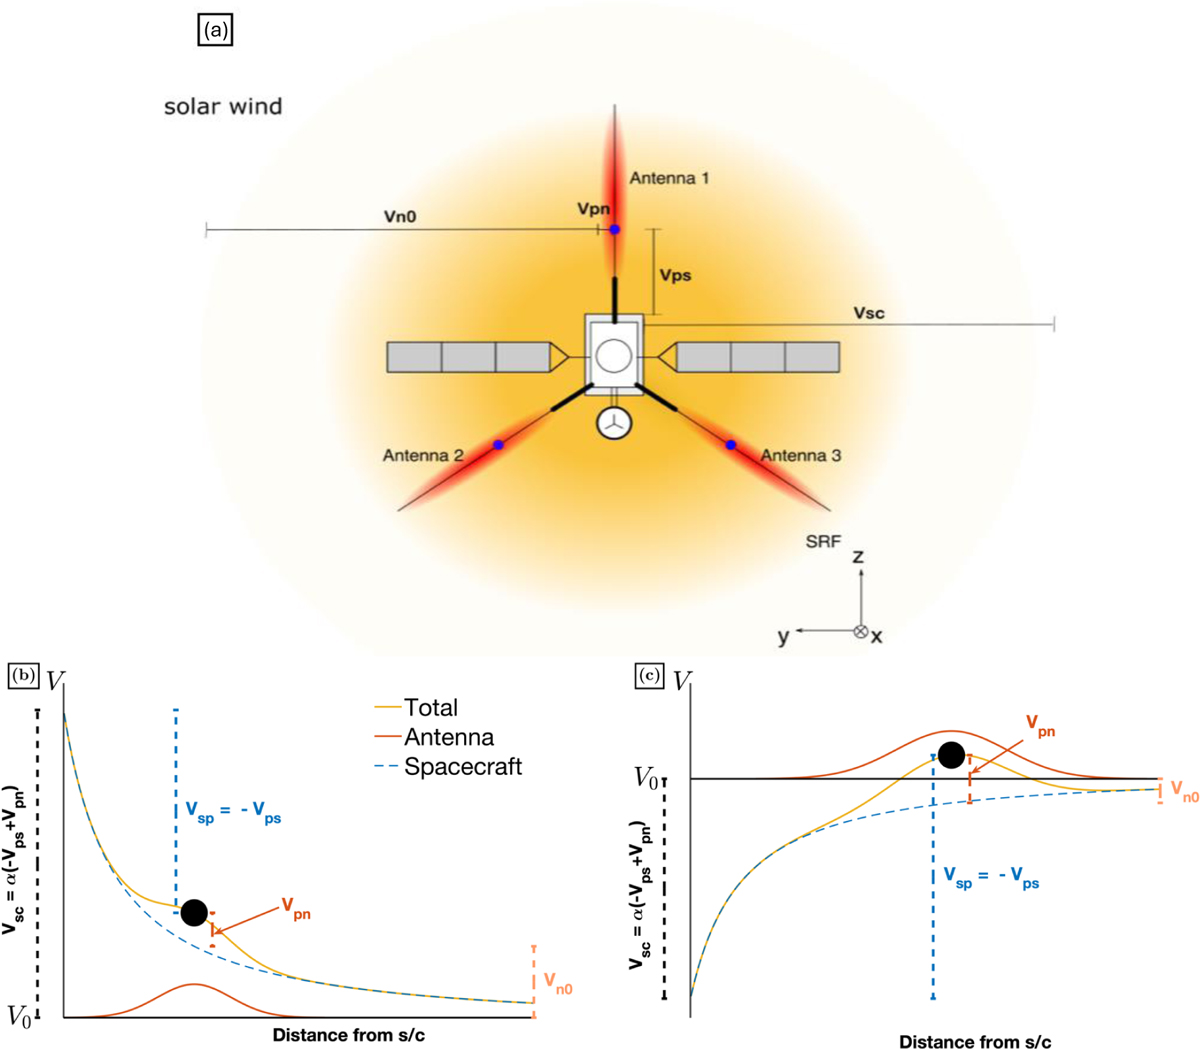
Schematic of Solar Orbiter’s electrostatic potential. (a) Simplified description of the electrostatic potential formed around the spacecraft body (yellow) and the three antennas (red). The color gradient indicates that the potentials decay with distance. For simplicity, the electrostatic potential is depicted as symmetrical and spherical around the spacecraft and the antennas, which is not necessarily the case. Furthermore, it changes with mission lifetime and solar wind conditions. (b) Spacecraft potential profile with respect to distance from the spacecraft surface along the axis of one of the antennas for the case when Vsc ≥ 0 V (dashed blue curve). Similarly, antennas (solid black circle) develop an electrostatic potential that decreases with distance from their surface (red curve). The total potential profile is the superposition of the antenna and spacecraft potentials (yellow). The total Vsc is the sum of the potential drop between the spacecraft surface and the probe (Vsp = −Vps), the potential drop between the probe and the surrounding plasma (Vpn), which is the plasma influenced by the spacecraft sheath at the antenna location, and the potential drop between the plasma surrounding the probe and the unperturbed solar wind (Vn0). (c) Same as in panel (b), but for the case where Vsc < 0 V.
Current usage metrics show cumulative count of Article Views (full-text article views including HTML views, PDF and ePub downloads, according to the available data) and Abstracts Views on Vision4Press platform.
Data correspond to usage on the plateform after 2015. The current usage metrics is available 48-96 hours after online publication and is updated daily on week days.
Initial download of the metrics may take a while.