Fig. 2
Download original image
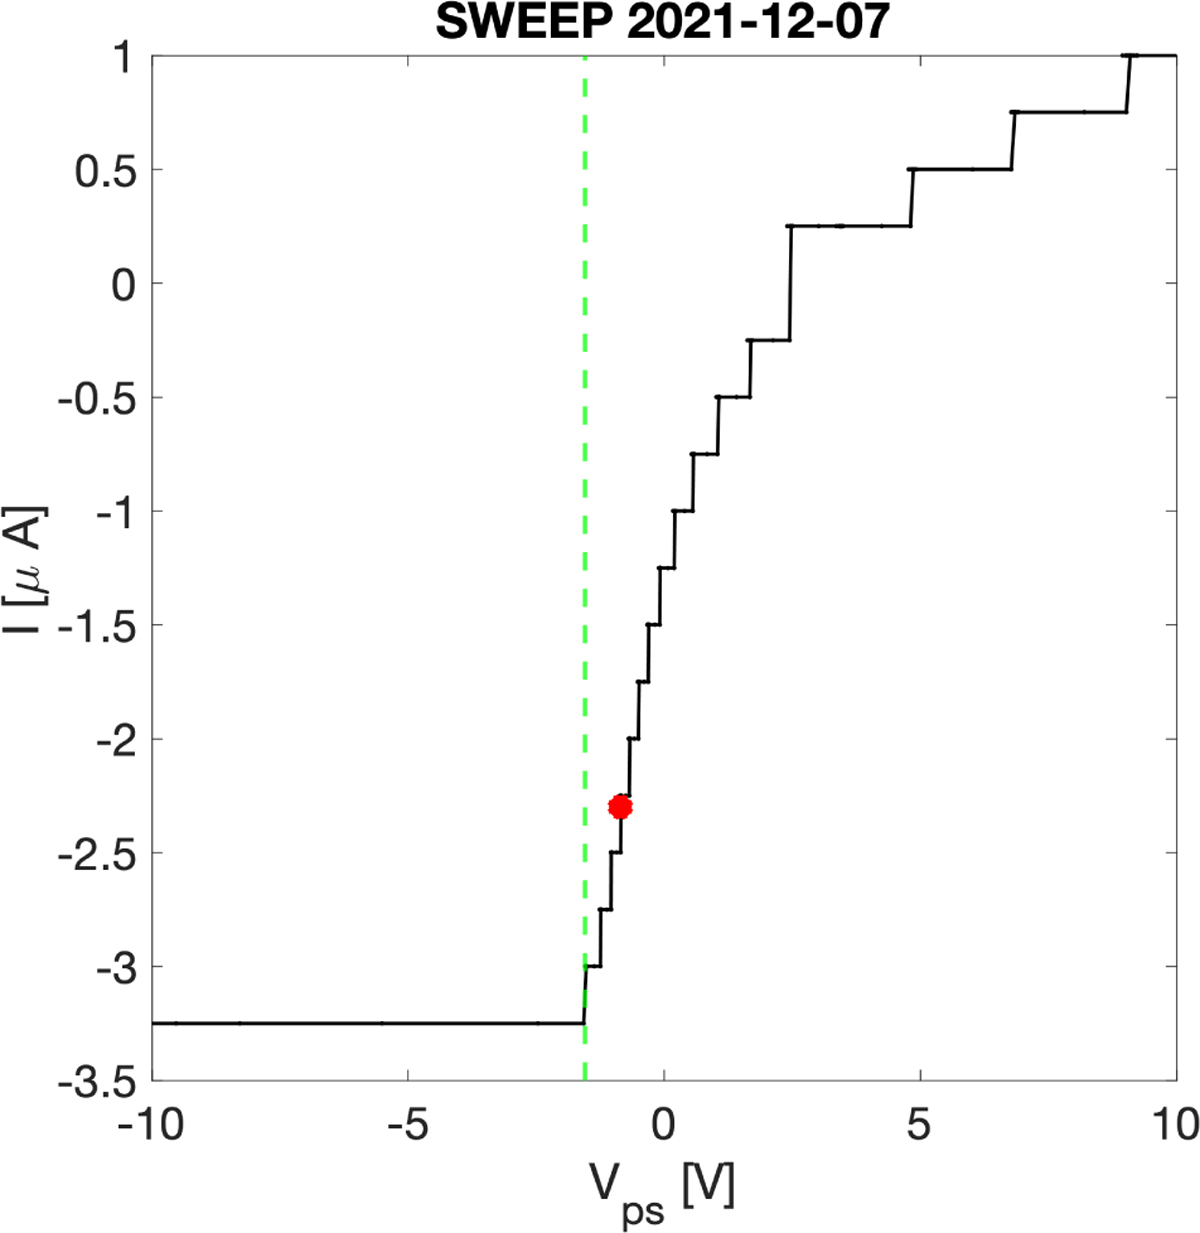
Example of an I-V curve from a current sweep performed by the Solar Orbiter RPW instrument with antenna 1. The red dot indicates the operating potential, which is the potential at which the antenna floats with the programmed bias current commanded between sweeps. The knee of the I–V marked with a dashed green vertical line indicates the Vps, where the probe switches from negative to positive potential. The potential difference between the operating voltage (Vps) and the knee of the I–V curve (dashed green line) is the probe-to-near plasma potential (Vpn).
Current usage metrics show cumulative count of Article Views (full-text article views including HTML views, PDF and ePub downloads, according to the available data) and Abstracts Views on Vision4Press platform.
Data correspond to usage on the plateform after 2015. The current usage metrics is available 48-96 hours after online publication and is updated daily on week days.
Initial download of the metrics may take a while.