Fig. 4
Download original image
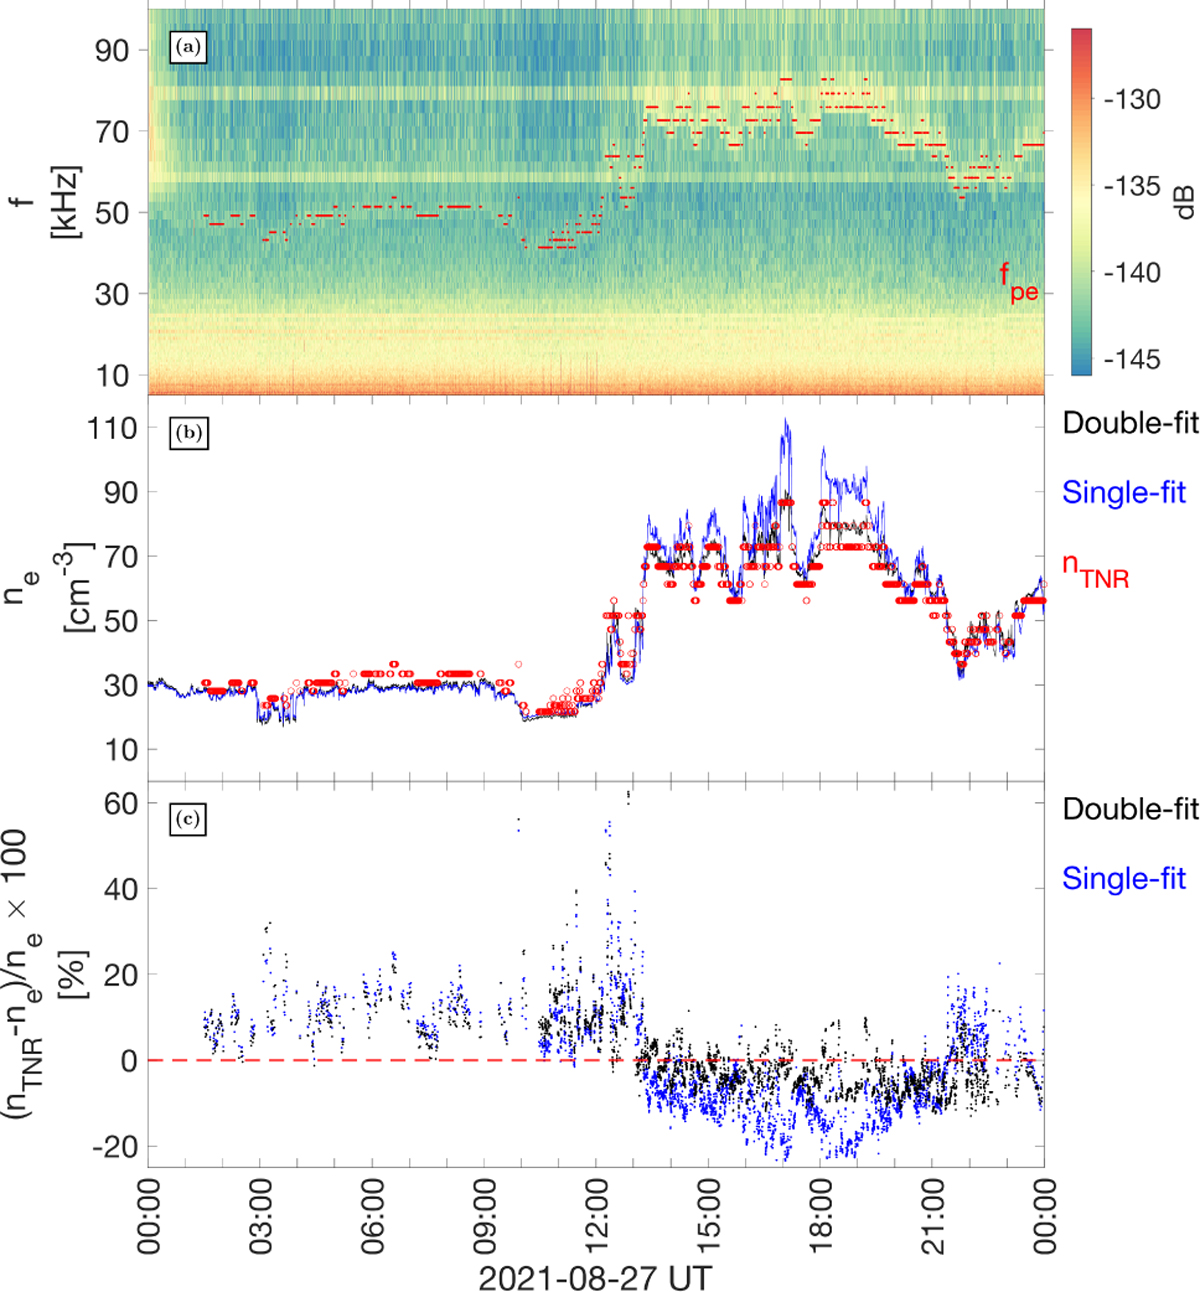
Example of RPW measurements and ne estimation. (a) Dynamic spectra of the antenna 1 and antenna 2 voltage signal. The plasma line, corresponding to fpe is visible as the enhanced signal between ~50–80 kHz. The red dots correspond to the low-cadence, non-continuous reference nTNR (b) Density estimated using calibration method of RPW data (black). The fit is used based on TNR plasma line detection (red circles). For comparison, we show the resulting ne from the single-fit estimation (blue), which does not account for the change in slope of the Vps − ln(nTNR) relationship. (c) Residual values (nTNR − ne)/ne × 100 of the double-fit (black) and single-fit (blue) estimation methods. This example corresponds to a section of the calibration interval in Fig. 5.
Current usage metrics show cumulative count of Article Views (full-text article views including HTML views, PDF and ePub downloads, according to the available data) and Abstracts Views on Vision4Press platform.
Data correspond to usage on the plateform after 2015. The current usage metrics is available 48-96 hours after online publication and is updated daily on week days.
Initial download of the metrics may take a while.