Fig. 5
Download original image
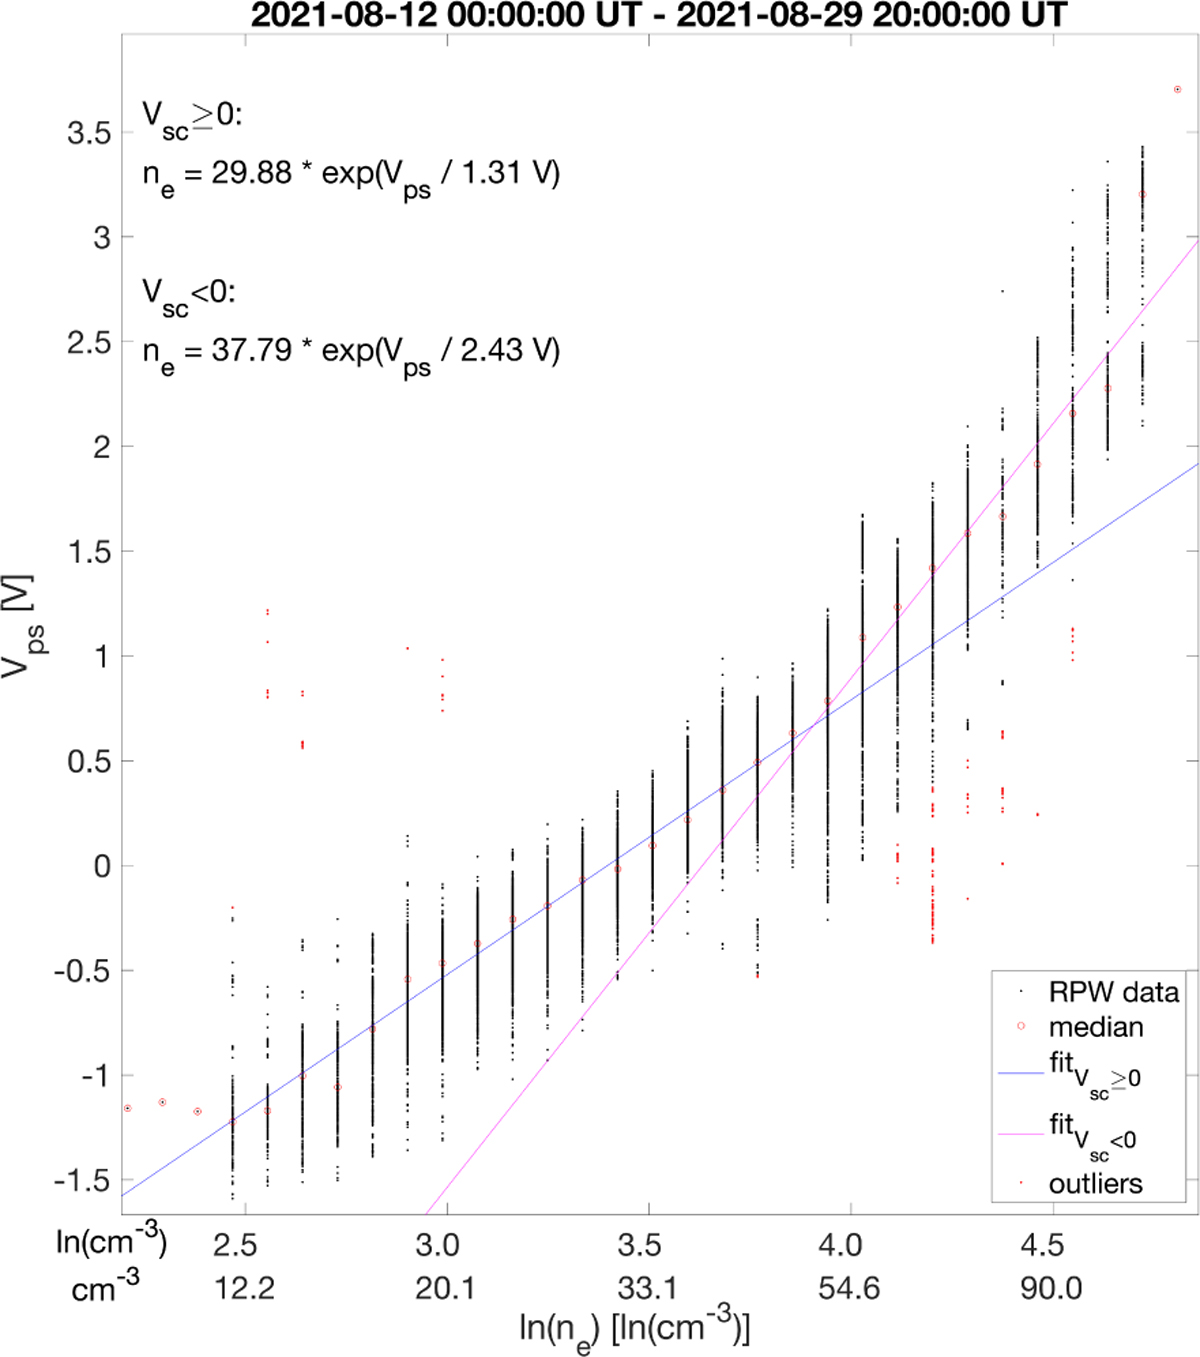
Example of a density calibration interval. The probe-to-spacecraft potential Vps is plotted against low cadence density nTNR determined by TNR plasma line measurements (black dots). The median for each nTNR value is indicated by magenta circles. Points at a distance ±1 V from the median are marked as outliers (red dots). If Vsc does not change sign, a linear relation is expected. If Vsc changes sign, two linear fits are required (blue and pink).
Current usage metrics show cumulative count of Article Views (full-text article views including HTML views, PDF and ePub downloads, according to the available data) and Abstracts Views on Vision4Press platform.
Data correspond to usage on the plateform after 2015. The current usage metrics is available 48-96 hours after online publication and is updated daily on week days.
Initial download of the metrics may take a while.