Fig. 6
Download original image
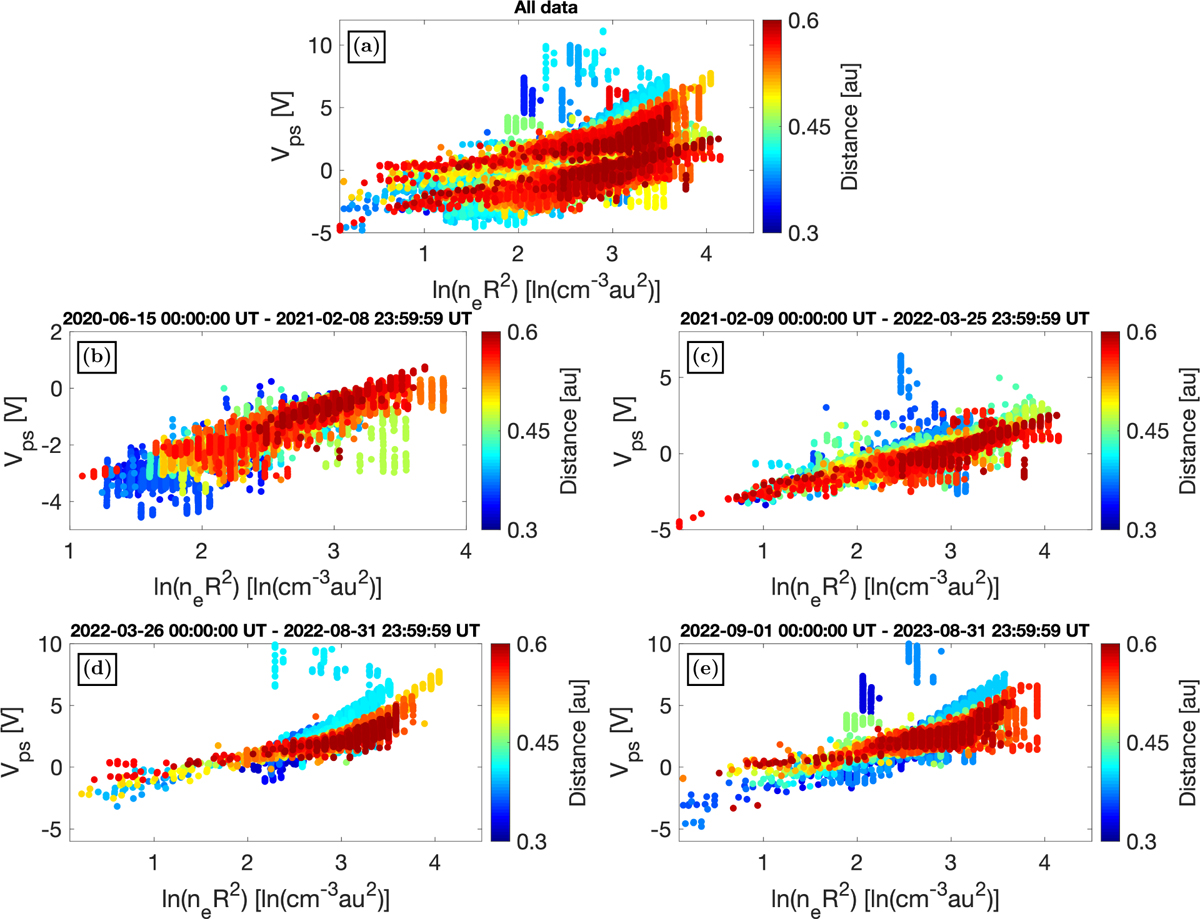
nTNR vs. Vps. (a) All data points from 2020-06-15 to 2023-08-31. (b) Data points from first to second perihelion. (c) Data points from the second to fourth perihelion. (d) Data from the fourth the fifth perihelion. (e) Data from the fifth perihelion to approximately one month before the sixth perihelion. Color code indicates distance from the Sun R in au.
Current usage metrics show cumulative count of Article Views (full-text article views including HTML views, PDF and ePub downloads, according to the available data) and Abstracts Views on Vision4Press platform.
Data correspond to usage on the plateform after 2015. The current usage metrics is available 48-96 hours after online publication and is updated daily on week days.
Initial download of the metrics may take a while.