Open Access
Fig. 2.
Download original image
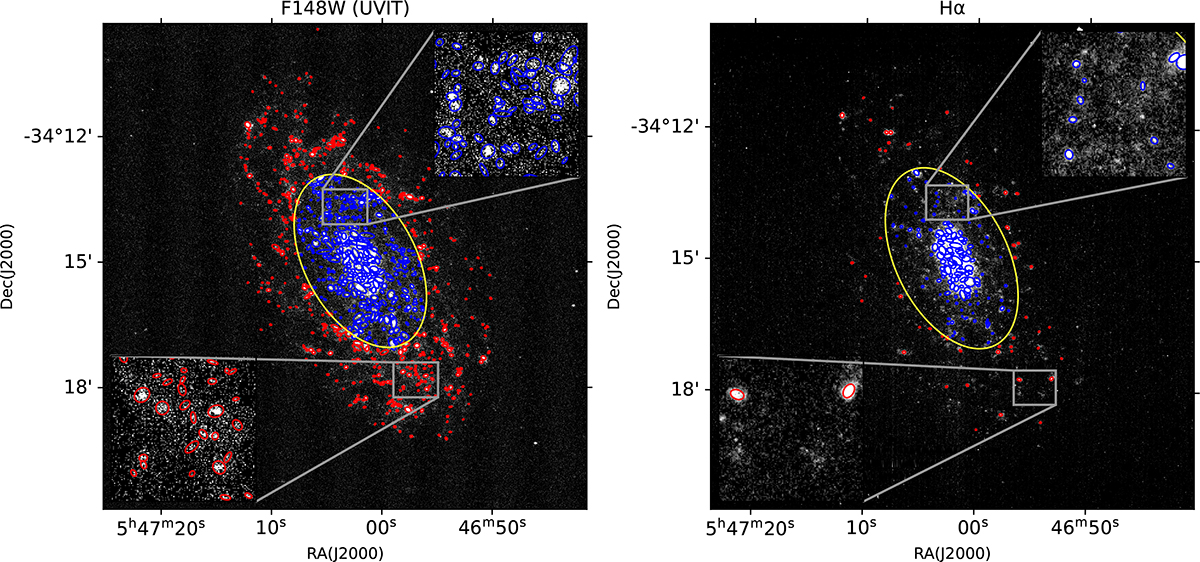
Identified SFCs in the FUV (left) and Hα (right). Blue and red symbols denote SFCs located inside and outside the optical radius, respectively, while the yellow contour marks the optical radius. The gray boxes highlight the regions shown in the inset, providing a zoomed-in view of the SFCs within those areas.
Current usage metrics show cumulative count of Article Views (full-text article views including HTML views, PDF and ePub downloads, according to the available data) and Abstracts Views on Vision4Press platform.
Data correspond to usage on the plateform after 2015. The current usage metrics is available 48-96 hours after online publication and is updated daily on week days.
Initial download of the metrics may take a while.