| Issue |
A&A
Volume 709, May 2026
|
|
|---|---|---|
| Article Number | A172 | |
| Number of page(s) | 13 | |
| Section | Extragalactic astronomy | |
| DOI | https://doi.org/10.1051/0004-6361/202659471 | |
| Published online | 13 May 2026 | |
Star formation beyond the optical disk
The low-density outskirts of NGC 2090
1
Instituto de Astrofísica de Canarias, Vía Láctea s/n, E-38205 La Laguna, Spain
2
Departamento de Astrofísica, Universidad de La Laguna, E-38206 La Laguna, Spain
3
Indian Institute of Astrophysics, Koramangala II Block, Bangalore 560034, India
4
Oxford Astrophysics, Denys Wilkinson Building, University of Oxford, Keble Road, Oxford OX1 3RH, UK
5
School of Sciences, European University Cyprus, Diogenes street, Engomi 1516, Nicosia, Cyprus
★ Corresponding author: This email address is being protected from spambots. You need JavaScript enabled to view it.
Received:
16
February
2026
Accepted:
24
March
2026
Abstract
We present a far-ultraviolet (FUV) analysis of the star-forming complexes (SFCs) in the nearby spiral galaxy NGC 2090 based on observations from the Ultraviolet Imaging Telescope, and compare the FUV emission with that from the optical and infrared bands. NGC 2090 exhibits prominent star formation in its extended outer disk, with FUV emission traced out to ∼30 kpc, far beyond the truncation of the old stellar disk at ∼5 kpc. It is classified as an extended UV (XUV) disk galaxy. We identified and characterized the SFCs both within and beyond the optical radius (R25), estimating their physical sizes and star formation rates (SFRs). The outer-disk SFCs are generally smaller in area and show a narrower distribution of SFR surface density (ΣSFR) compared to the inner-disk SFCs. We investigated the properties of the inner disk using mid-infrared data from the James Webb Space Telescope and find that the polycyclic aromatic hydrocarbon emission is strongly correlated with regions of active star formation. The specific SFR increases with radius, consistent with a scenario of inside-out disk growth. The observed number of SFCs and their Hα-to-FUV flux ratios in the outer disk of NGC 2090 indicate ongoing massive star formation and are consistent with a top-heavy initial mass function (IMF), implying that the upper end of the IMF is not truncated in the low-density, metal-poor outskirts. These results suggest that XUV disks can host significant massive star formation despite their low stellar densities and metallicities.
Key words: galaxies: general / galaxies: ISM / galaxies: individual: NGC 2090 / galaxies: star clusters: general / galaxies: star formation
© The Authors 2026
 Open Access article, published by EDP Sciences, under the terms of the Creative Commons Attribution License (https://creativecommons.org/licenses/by/4.0), which permits unrestricted use, distribution, and reproduction in any medium, provided the original work is properly cited.
This article is published in open access under the Subscribe to Open model. This email address is being protected from spambots. You need JavaScript enabled to view it. to support open access publication.
1. Introduction
Star formation in the outer disks of galaxies differs fundamentally from that in their inner regions, reflecting differences in stellar surface densities and gas properties (Bigiel et al. 2010b). Inner disks typically have higher stellar and gas densities, higher metal contents, and more dust, conditions that favor the formation of massive star-forming regions. In contrast, outer disks are more metal-poor, dust-poor, and have much lower stellar surface densities, making them adverse environments for forming massive stars (Bush et al. 2008, 2010).
Despite the low stellar and gas densities observed in the outer disk, ongoing massive star formation has been observed beyond the optical radius (R25) in several nearby galaxies through Hα and UV emission (Ferguson et al. 1998; Lelièvre & Roy 2000; Cuillandre et al. 2001; de Blok & Walter 2003; Christlein & Zaritsky 2008; Herbert-Fort et al. 2010; Goddard et al. 2010; Werk et al. 2010; Yadav et al. 2021b; Das et al. 2021). A key breakthrough came with the discovery of extended ultraviolet (XUV) disks by the Galaxy Evolution Explorer (GALEX) mission, which found that about 30% of nearby galaxies (D < 40 Mpc) host significant star formation beyond R25 (Donas et al. 1981; Gil de Paz et al. 2005, 2007b; Thilker et al. 2005, 2007). These XUV disks are mainly seen in gas-rich, late-type spirals. There are mainly two types of XUV galaxies. Type-1 XUV galaxies show extended star formation that follows spiral structures into the outer disk, while Type-2 XUV galaxies show star formation in their low-surface-brightness (LSB) outer blue disks; some galaxies display both characteristics and are classified as mixed XUV disks. Other examples of star formation in diffuse environments are classical LSB galaxies, where molecular gas is rarely detected (Das et al. 2006, 2010); however, far-ultraviolet (FUV) and Hα observations reveal ongoing star formation activity (Boissier et al. 2007; Yadav et al. 2022).
Cold gas, particularly molecular gas, is also critical for star formation. While outer disks of XUV galaxies show significant reservoirs of neutral atomic hydrogen (HI; Boissier et al. 2003; Zaritsky & Christlein 2007), molecular gas traced by CO is usually scarce, and CO detections are rare (Lundgren et al. 2004; Dessauges-Zavadsky et al. 2014; Bicalho et al. 2019). Multicomponent stability analyses show that colder gas, characterized by a lower velocity dispersion, plays a dominant role in triggering disk instabilities and regulating the scales over which they develop (Bertin & Romeo 1988; Romeo & Falstad 2013; Romeo & Fathi 2015, 2016; Romeo & Mogotsi 2017). The relationship between HI gas and star formation has been extensively studied across a variety of galactic environments, including the outer disks of galaxies. While the general correlation remains similar to that observed in inner regions, it exhibits a noticeably steeper slope in the outskirts (Bigiel et al. 2010b,a). These regions are also characterized by significantly lower star formation efficiencies (Bigiel et al. 2010a), indicating that the physical conditions governing star formation in the outer disk can differ from those in the inner galaxy.
Galaxies are thought to continuously accrete material from beyond their virial radii over cosmic time, providing a sustained reservoir that supports ongoing star formation, particularly in their outer disks (Rees & Ostriker 1977; White & Rees 1978; Katz & Gunn 1991; Kereš et al. 2005; Dekel et al. 2009). Cosmological simulations predict that such cold gas can be transported inward at velocities of 20–60 km s−1 from regions extending well beyond the stellar disk (Dekel & Birnboim 2006; Dekel et al. 2009). Star formation in the extended disk can also be facilitated by the deposition of gas during recent or ongoing galactic interactions (Thilker et al. 2007; Yadav et al. 2023). In low-density environments, star formation is mainly attributed to external processes, including gas inflows induced by interactions or the gradual accretion of cold gas from the intergalactic medium or the cosmic web (Lemonias et al. 2011; Yadav et al. 2021a; Yadav & Jadhav 2024).
Understanding the nature of star formation in galaxies requires knowledge of the stellar initial mass function (IMF), whose universality across different galactic environments remains a central question. Observational studies have long supported the idea of a universal IMF (Kroupa 2002; Bastian et al. 2010; Koda et al. 2012), yet growing evidence points to potential IMF variations driven by environmental factors such as gas density and metallicity. Systematic variations in the IMF are predicted by theoretical studies (Adams & Fatuzzo 1996; Adams & Laughlin 1996; Larson 1998; Dib et al. 2007) and have been increasingly supported by observational evidence. Detailed reviews can be found in Kroupa et al. (2013) and Hopkins (2018). High-gas-density, low-metallicity environments favor the formation of massive stars, resulting in a top-heavy IMF (Matteucci 1994; Dabringhausen et al. 2009; Marks et al. 2012; Zhang et al. 2018; Schneider et al. 2018; Kalari et al. 2018; Brown & Wilson 2019), and a top-light IMF is seen in systems with low star formation rates (SFRs; Elmegreen 2004; Meurer et al. 2009; Lee et al. 2009; Watts et al. 2018). Ultraviolet emission primarily traces massive O and B stars, while Hα emission, originating from ionized gas, directly reflects the presence of the most massive O stars (> 20 M⊙; Kennicutt 1998). Therefore, the combined use of FUV and Hα fluxes provides a powerful diagnostic to probe the upper end of the IMF, especially in extended, low-density outer disks of galaxies.
In this study, we investigated the star formation properties of the Type-2 XUV disk galaxy NGC 2090, which exhibits prominent FUV emission well beyond its optical radius that is indicative of ongoing star formation in its low-density outer regions. Our primary objective was to examine how star formation in the extended outer disks of Type-2 XUV disk galaxies compares with that in the bright inner disk. The extended disks have properties similar to those of LSB galaxies, which generally exhibit LSBs, blue colors (de Blok et al. 1995), substantial reservoirs of neutral gas (O’Neil et al. 1998), and low metallicities (McGaugh 1994). Likewise, XUV regions are metal-poor (Gil de Paz et al. 2007b) and are typically found in galaxies that are systematically more gas-rich than the general field population (Thilker et al. 2007). These similarities suggest that star formation in XUV disks and LSB galaxies have similar properties. Thus, XUV galaxies provide us with a tool for understanding star formation properties in low-density environments.
Ultraviolet photons from massive young star-forming regions excite polycyclic aromatic hydrocarbons (PAHs), producing prominent emission features at 3.3, 6.2, 7.7, 8.6, and 11.3 μm and thereby directly linking the emission to sites of active star formation (Tielens 2008; Li 2020). In galaxies experiencing intense star formation, as much as 20% of the total infrared luminosity is emitted in the PAH bands alone (Smith et al. 2007). Observationally, they serve as effective tracers of both cold gas (Rigopoulou et al. 1999; Cortzen et al. 2019; Gao et al. 2019, 2022; Leroy et al. 2023; Sandstrom et al. 2023b; Whitcomb et al. 2023; Chown et al. 2025) and the heating processes associated with star formation activity (Peeters et al. 2004; Calzetti et al. 2007; Calapa et al. 2014; Cluver et al. 2017; Pathak et al. 2024; Gregg et al. 2024). Studies have examined the effects of high-energy photons on dust in HII regions (Riener et al. 2018), and recent James Webb Space Telescope (JWST) observations have begun to resolve the properties of PAHs in such regions with unprecedented detail (Chastenet et al. 2023b). To investigate the characteristics of PAH molecules, it is essential to analyze high-resolution infrared observations. With the high sensitivity and spatial resolution in the mid-infrared, JWST now enables detailed studies of PAH emission in individual HII regions, supernova remnants, star clusters, and their immediate surroundings in nearby galaxies (Dale et al. 2023; Egorov et al. 2023; Sutter et al. 2024; Chastenet et al. 2023a; Sandstrom et al. 2023a; Pedrini et al. 2024; Gregg et al. 2024; Baron et al. 2024, 2025; Ujjwal et al. 2024). We therefore incorporated high-resolution mid-infrared imaging from the JWST, which provides a detailed view of the inner disk. This allowed us to directly trace the PAH emission surrounding young massive stars. By combining these JWST observations with other multiwavelength diagnostics, we could robustly characterize star formation across diverse galactic environments and gain new insights into the star formation processes in NGC 2090.
2. NGC 2090
NGC 2090 is an isolated spiral galaxy classified as SA:(rs)b. The UV emission is clearly detected in the extended outer disk, presenting as a smooth structural continuation of the main stellar disk rather than as discrete outer complexes or detached features. It is classified as a Type 2 XUV disk galaxy, as it has an extended outer LSB disk region that lies within the SF threshold, and is blue in color (Thilker et al. 2007). The galaxy is at a redshift of 0.003075 (Springob et al. 2005) and has a log MHI (M⊙) of ∼9.35 (Thilker et al. 2007). NGC 2090 hosts a significantly extended LSB zone, covering an area more than ten times larger than the effective radius (encompassing 80% of the old stellar light) of the central stellar disk. Ultraviolet imaging from GALEX highlights a clear distinction between the inner and outer regions of the galaxy (Thilker et al. 2007). The extended LSB zone shows numerous H II regions, providing direct evidence of ongoing star formation in the extended outer disk (Koopmann & Kenney 2006). The spiral arms in the outer disk appear to be flocculent in nature (Fig. A.1). The details of NGC 2090 are presented in Table 1.
Details of NGC 2090.
3. Observations and analysis
We conducted deep FUV imaging of the galaxy NGC 2090 using the Ultraviolet Imaging Telescope (UVIT) on board the AstroSat satellite (Kumar et al. 2012). UVIT consists of two co-aligned Ritchey-Chrétien telescopes: one dedicated to the FUV range (1300–1800 Å) and the other designed for simultaneous imaging in the near-ultraviolet (NUV; 2000–3000 Å) and visible bands. The instrument allows for simultaneous observations across all three channels, with the visible channel primarily utilized for drift correction. UVIT has a variety of photometric filters in both the FUV and NUV bands, features a field of view of approximately 28′, and achieves spatial resolutions of 1 4 in FUV and 1
 2 in NUV. UVIT offers a spatial resolution that is approximately three times better than that of GALEX. We processed the Level 1 data using CCDLAB (Postma & Leahy 2017), software with a graphical interface that applies corrections for field distortion, flat-field variations, and image drift to generate science-ready data. Astrometric calibration was carried out using Gaia data.
We utilized archival imaging data from the JWST obtained with the Near Infrared Camera (NIRCam; Rieke et al. 2005) and the Mid-Infrared Instrument (MIRI; Rieke et al. 2015). We used archival JWST MIRI F770W and F2100W images and the NIRCam filters F300M, F335M from on board the JWST as the source of PAH emission (PI: Adam Leroy, Proposal ID: 3707). The F770W image has a resolution of 0.26″, and F2100W images have an angular resolution of 0.67″. NIRCam filters F300M, F335M, and F360M have an approximate angular resolution of around 0.1″.
We utilized archival g-, r-, and z-band imaging data from the Dark Energy Camera Legacy Survey (DECaLS). DECaLS employs the Dark Energy Camera (DECam; Flaugher et al. 2015), which is mounted on the 4 meter Victor M. Blanco Telescope at the Cerro Tololo Inter-American Observatory. It covers a wide field of view of 2.2° in diameter and offers a pixel scale of 0.262 arcsec per pixel.
We used archival Hα imaging data from Koopmann & Kenney (2006). The observations were conducted using the 0.9-meter telescope at Kitt Peak National Observatory, equipped with the Tek2K-1 charge-coupled device detector at the Cerro Tololo Inter-American Observatory. The images were processed by performing continuum subtraction, sky subtraction, and flux calibration. The resolution is ∼1″. A detailed description of the data acquisition and reduction procedures can be found in Koopmann et al. (2001), Koopmann & Kenney (2006).
We additionally utilized archival data from the Spitzer Space Telescope, obtained with the Infrared Array Camera (IRAC). IRAC provides imaging in four mid-infrared bands. In this work, we used Channel 2 (CH2; 4.5 μm) and Channel 4 (CH4; 8.0μm) observations.
4. Analysis
4.1. Multiwavelength emission
To investigate the star formation properties of NGC 2090, we examined its emission across multiple wavelengths, as shown in Fig. A.1. NGC 2090 is an actively star-forming galaxy with log SFR = –0.14 M⊙ yr−1 (Thilker et al. 2007), and both the FUV and Hα maps reveal significant ongoing massive star formation in its XUV disk. NGC 2090 shows strong FUV and Hα emission across both its inner and extended outer disk. However, the Two Micron All-Sky Survey (2MASS) K-band image shows dominant emission from the central region and no significant emission in the outer disk, consistent with an older, more evolved stellar population concentrated in the inner disk. The g-band image (central wavelength ≈473 nm) primarily traces the stellar continuum and shows the stellar disk (Fig. A.1, top row, third column).
The JWST observations used in this study cover only the central regions of the NGC 2090. The F335M filter captures both stellar continuum and PAH emission features. In particular, the prominent 3.3 μm feature arises from the C–H stretching modes of small, predominantly neutral PAH molecules, which are commonly excited by ultraviolet photons in star-forming regions (Ricca et al. 2012; Draine et al. 2021). The F770W filter shows the emission from larger, ionized PAH grains, primarily through the C–C stretching and C–H in-plane bending modes (Allamandola et al. 1989; Galliano et al. 2008; Maragkoudakis et al. 2018, 2022; Draine et al. 2021; Rigopoulou et al. 2021). The F2100W filter shows warm dust continuum emission. This emission originates from interstellar dust grains that absorb ultraviolet photons from young, massive stars and subsequently re-emit the energy in the mid-infrared. The F2100W image traces the locations of dust-embedded star-forming regions within the central regions of these galaxies. The JWST images, particularly in the F2100W band, display instrumental artifacts affecting certain regions of the data. These features likely arise from detector readout variations, residual background subtraction errors, or imperfect flat-fielding, and they may impact quantitative measurements.
4.1.1. Color maps
Color maps of galaxies provide a powerful tool for tracing spatial variations in stellar populations, dust, and star formation history across the disk (Muñoz-Mateos et al. 2007a; Bakos et al. 2008). In particular, FUV-g and IRAC CH4 (8.0 μm) – CH2 (4.5 μm) colors probe recent star formation and dust emission in galaxies, offering a complementary view of disk evolution (Boissier et al. 2007; Muñoz-Mateos et al. 2007a; Gil de Paz et al. 2007a). To explore the spatial distribution of stellar populations in NGC 2090, we constructed two-dimensional color maps using our FUV, optical imaging, and Spitzer IRAC CH4 and CH2 data. We re-projected the g-band data to the pixel scale of the FUV imaging and corrected the Galactic extinction for each band. We convolved FUV imaging to g-band resolution and IRAC CH2 to CH4 resolution. Figure 1 shows the FUV-g (left) and IRAC CH4-CH2 (right). The FUV-g map reveals that the spiral arms are significantly bluer than the inner disk, consistent with ongoing, recent star formation along the arms. However, the inner disk appears redder, which could be due to an older, more evolved population of cooler, low-mass stars concentrated in the central regions, or alternatively, stronger attenuation of FUV emission by dust, as the central regions typically have a higher dust content than the outer disk.
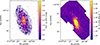 |
Fig. 1. FUV-g (left) and Spitzer IRAC CH4-CH2 (right) color maps of NGC 2090. The FUV–g map highlights the bluer spiral arms, indicative of recent star formation, while the IRAC CH4-CH2 map traces regions of bright dust and PAH emission. |
The Spitzer IRAC CH4-CH2 color map is an effective tracer of PAH and dust emission. The CH4 band is dominated by strong PAH emission (7.7 μm, 8.6 μm) and hot dust, which trace star-forming regions, while CH2 traces mostly stellar continuum. The color map (Fig. 1, right panel) is brighter along the spiral arms and within the central regions of the galaxy. These bright regions are indicative of localized dust lanes, where dust obscures the stellar light. Similarly, the dust content in the central regions may be associated with higher gas and dust densities.
4.1.2. SFC detection and estimation of the SFR
NGC 2090 displays bright UV and Hα emission extending throughout its outer disk, indicating the presence of star-forming complexes (SFCs). To identify and extract these SFCs, we employed the Source Extractor (SExtractor; Bertin & Arnouts 1996), a Python-based tool widely used for source detection and photometry. SExtractor detects sources by applying a user-defined threshold, identifying connected pixels with flux values exceeding this limit. For our analysis, we adopted a detection threshold of 3σ, where σ corresponds to the root mean square of global background noise.
Figure 2 shows the identified SFCs in FUV(left) and Hα(right). We divided the SFCs into inner and outer regions based on the optical radius (R25). We performed elliptical aperture photometry on the detected sources using the Photutils package. Foreground Galactic extinction was corrected using the Fitzpatrick extinction law (Fitzpatrick 1999), assuming a total-to-selective extinction ratio of R(V) = 3.1:
 (1)
(1)
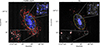 |
Fig. 2. Identified SFCs in the FUV (left) and Hα (right). Blue and red symbols denote SFCs located inside and outside the optical radius, respectively, while the yellow contour marks the optical radius. The gray boxes highlight the regions shown in the inset, providing a zoomed-in view of the SFCs within those areas. |
where Aλ is the extinction at wavelength λ, and E(B-V) is the reddening. The NUV data from UVIT are not available; thus, we used GALEX FUV and NUV data for internal extinction correction. We estimated the UV β slope using GALEX FUV and NUV data using the relation provided by Onodera et al. (2016):
 (2)
(2)
We used the βUV to estimate the FUV extinction using the relation provided by Figueira et al. (2022):
 (3)
(3)
We created an FUV extinction map from GALEX and re-projected it to UVIT pixel scale, assuming that the extinction does not vary much within GALEX resolution. To correct for attenuation by dust within the galaxy in Hα, we used the correlation AHα = AFUV/3.6 (Leroy et al. 2008). We re-projected the extinction map to Hα image. We calculated the SFR in the FUV for each of the SFCs using the following formula (Leroy et al. 2012; Salim et al. 2007):
 (4)
(4)
where SFR(FUV) is the SFR in FUV [M⊙ yr−1] and LFUV is the FUV Luminosity [erg s−1 Hz−1]. We used Calzetti et al. (2007) law to calculate the SFR for each SFC in Hα:
 (5)
(5)
where SFR(Hα) is the SFR in Hα [M⊙ yr−1]. LHα is the Hα Luminosity [erg s−1]. We defined ΣSFR as the SFR/Area of the SFCs.
The number of identified SFCs in FUV and Hα is given in Table 2. The FUV has a higher number of SFCs in the outer disk compared to the inner disk, while Hα emission predominantly traces SFCs in the inner disk. The number of SFCs detected in FUV is larger than that identified in Hα in both regions, indicating more spatially extended and longer-timescale star formation that is preferentially traced by FUV emission.
Number of detected SFCs in the FUV and Hα in the inner and outer disks.
The detection of Hα emission in the outer disk traces ionized gas powered by massive O-type stars and therefore implies star formation on timescales of only a few million years (Kennicutt 1998). This supports the existence of recent, high-mass star formation in the low-density outer regions. The presence of such stars indicates that a truncated IMF in the outer disk is unlikely. A truncated IMF would fail to produce the most massive stars altogether, while a stochastic IMF could still form them occasionally, though with low probability in low-mass clusters. Thus, detecting even a small number of outer disk Hα sources implies that the upper IMF is not truncated.
Koda et al. (2012) demonstrated that, under the assumptions of instantaneous cluster formation and a constant cluster formation rate, the ratio of Hα-emitting to FUV-emitting clusters reflects the ratio of their characteristic lifetimes, such that NHα/NFUV = tHα/tFUV. FUV emission traces star formation over timescales of approximately 100 Myr (Donas & Deharveng 1984; Schmitt et al. 2006; Thilker et al. 2007), while Hα emission is sensitive to more massive and younger stellar populations, up to around 10 Myr (Weisz et al. 2012; Caplar & Tacchella 2019; Haydon et al. 2020). We measure this number ratio in the outer disk of NGC 2090 to be NHα/NFUV ≈ 0.11, similar to the value reported by Koda et al. (2012) for M83. Their models that use STARBURST99, a Salpeter IMF with (Ml, Mu) = (0.1, 100) M⊙, and a subsolar metallicity (0.2 Z⊙) predict tHα/tFUV ∼ 0.08, and they measured an observational ratio of NHα/NFUV = 0.10 ± 0.03. Our results are thus consistent with a standard Salpeter IMF in the outer disk.
Figure 3 shows the distribution of area and log(ΣSFR) for the identified SFCs in both FUV and Hα. The physical sizes of SFCs are comparable between the two tracers across the inner and outer disks. However, the inner disk SFCs span a wider range in area compared to those in the outer disk. The inner disk SFCs have log(area(kpc2)) values ranging from –2 to 0, whereas the outer-disk SFCs range from –2 to –1. The log(ΣSFR(M⊙ yr−1 kpc−2)) ranges from approximately −3 to −1 in FUV and from −2.5 to 0 in Hα. The Hα data from Koopmann & Kenney (2006) have not been corrected for [N II] contamination (λλ 6548.1, 6583.8 Å). Kennicutt (1992) estimated a median [N II]/Hα ratio of 0.53 in H II regions, which decreases in fainter galaxies (Jansen et al. 2000). James et al. (2005) further demonstrate that the [N II]/Hα ratio is lower than previously estimated and shows a strong radial dependence, indicating that the application of a single correction factor to all SFCs is not appropriate. Consequently, the Hα images contain contributions from [N II] emission, which likely leads to systematically higher ΣSFR estimates compared to those derived from FUV.
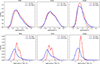 |
Fig. 3. Area (top) and ΣSFR (bottom) of SFCs in the FUV (blue) and Hα (red). |
4.2. PAH emission in the JWST F335M band
In most AKARI InfraRed Camera studies, the strength of the 3.3 μm PAH feature is estimated by fitting a linear continuum and integrating the emission above it (Imanishi et al. 2008, 2010; Ichikawa et al. 2014; Inami et al. 2018; Lai et al. 2020). We used a similar method but with Spitzer IRAC1 data. The Spitzer IRAC1 band broadly overlaps with the JWST F335M filter; both cover emission near 3.6 μm. To estimate the continuum shape in this regime, we first re-projected and convolved the JWST F335M and F330M images onto the IRAC1 pixel grid and resolution, respectively. We then subtracted the F335M image from the IRAC1 map, producing a residual image we refer to as F′360, which approximates the continuum near 3.6 μm.
Using the data from F300M and F′360, we derived the continuum slope using the following relation:
 (6)
(6)
where F′360 and F300M represents the data and λeffF360M and λeffF300M are the effective wavelengths of the respective filters.
We re-projected the slope map, denoted as m′, onto the F335M pixel grid and refer to the resulting re-projected slope as m. We used this slope to estimate the continuum contribution at the location of the F335M band, using the following equation:
![Mathematical equation: $$ \begin{aligned} \mathrm F335M\ Cont = m \left[\lambda _{\mathrm{eff F335M} } - \lambda _{\mathrm{eff F300} }\right] + \mathrm{F300M} .\end{aligned} $$](/articles/aa/full_html/2026/05/aa59471-26/aa59471-26-eq9.gif) (7)
(7)
We subtracted the continuum F335MCont from F335M filter data to get the F335MPAH emission. Figure 4 shows the emission maps in the F335M filter: the observed F335M image (left panel), the underlying stellar continuum component F335MCont (middle panel), and the isolated 3.3 μm PAH emission component F335MPAH (right panel). The x-y axes of the maps are not aligned with the RA-Dec coordinate system, as the coordinate transformation alters both flux and pixel values. To preserve the integrity of the measurements, we kept the original orientation. The apparent central deficit in PAH emission is most likely not physical but instead arises from uncertainties in the continuum subtraction process. We therefore interpreted the central PAH cavity with caution and do not consider it robust evidence for a true depletion of PAH emission in the galaxy center. The F335MPAH map reveals a clumpy morphology with compact regions distributed along the spiral arms of NGC 2090. These clumps spatially coincide with regions of FUV emission, which trace young, massive SFCs. The correlation between the FUV bright SFCs and the enhanced 3.3 μm PAH emission strongly suggests that the ultraviolet photons emitted by these young stars excite the small PAH molecules responsible for the 3.3 μm feature.
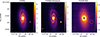 |
Fig. 4. Observed F335M image (left), the underlying stellar continuum in F335M (middle), and the isolated PAH emission component at 3.3 μm (right). |
4.3. Band ratios
Mid-infrared flux ratios using JWST bands provide powerful diagnostics of dust properties and PAH emission in star-forming regions. Infrared emission features at 3.3, 6.2, 7.7, 8.6, and 11.3 μm are commonly attributed to infrared fluorescence from PAH molecules primarily excited by FUV photons, with additional contributions from lower-energy NUV and optical radiation. As a result, these features broadly trace the recent star formation (Rigopoulou et al. 1999; Peeters et al. 2004). Ratios such as F335/F770 and F770/F2100 provide a means to compare the relative contributions of PAH emission and hot dust continuum, and to examine variations associated with star-forming regions (Smith et al. 2007; Yamada et al. 2013; Rigopoulou et al. 2024; Gregg et al. 2024) These diagnostics are crucial for understanding the interplay between star formation, dust heating, and ISM conditions in galaxies.
To investigate the spatial variations of PAH emission and dust continuum in NGC 2090, we constructed band ratio maps using F335M/F770W and F770W/F2100W (Fig. 5). We re-projected the F335M image to align with the pixel grid of the F770W image, while the F770W and F2100W images from MIRI share the same native pixel scale. We convolved F335PAH to F770W resolution to get F335PAH/F770W. We convolved F770W to F2100W resolution to get the F770W/F2100W band ratio.
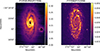 |
Fig. 5. Maps of the F335MPAH/F770W (left) and F770W/F2100W band ratios (right). |
The resulting ratio maps display substantial spatial variations. Although the JWST artifacts are present in the maps, they do not significantly affect the derived ratio maps. The spatial variations in the emission ratios remain clearly discernible across the galaxy. The 7.7 μm emission is consistently higher than the 3.3 μm emission throughout the inner disk. However, the F335M/F770W ratio shows localized enhancements along the spiral arms, indicating a relative increase in the 3.3 μm emission with respect to the 7.7 μm feature in these regions, though the latter remains dominant. This suggests that the spiral arms host physical conditions favorable for the excitation of the 3.3 μm feature, which is typically associated with small, neutral PAHs excited by UV photons from young stars. The elevated F335M/F770W ratios may therefore reflect a higher relative contribution from small PAHs in SFCs. Incomplete subtraction of the stellar and hot dust continuum can artificially reduce the PAH signal in the nucleus, producing an apparent central depletion in the F335M/F770W ratio that is likely not real. This suggests that the inner PAH distribution should be interpreted with caution and may not reflect a true physical deficit. In contrast, the overall high 7.7 μm emission in the inner disk is consistent with an increased fraction of ionized PAHs, as commonly observed near active star formation sites or active galactic nuclei (Egorov et al. 2023; Rigopoulou et al. 2024; García-Bernete et al. 2024; Zhang et al. 2025). Although theoretical studies suggest that small PAHs are more easily destroyed in harsh environments with hot gas and strong radiation fields (Micelotta et al. 2010), it is also possible that the harder radiation near SFCs primarily heats the PAHs, shifting their emission to shorter wavelengths and enhancing the 3.3 μm feature without a significant change in the small-PAH fraction (Draine et al. 2021).
The F770W/F2100W ratio shows the PAH strength relative to warm dust continuum. The F770W/F2100W ratio maps show higher values in regions corresponding to SFCs, indicating that PAH emission is stronger compared to warm dust emission. This trend is consistent with findings by Dale et al. (2025), who reported a positive correlation between the age of compact stellar clusters and the degree of PAH ionization.
4.4. Radial profiles
4.4.1. Multiwavelength analysis
We used the Photutils package to perform elliptical isophote fitting and derive the radial surface brightness profiles of the galaxy. The isophotal fitting was carried out using an iterative approach based on the algorithm introduced by Jedrzejewski (1987), which allows for accurate modeling of the light distribution. This method fits a series of elliptical isophotes to the galaxy image, adjusting parameters such as the semimajor axis length, ellipticity, and position angle at each step to best match the observed flux distribution. The resulting radial profile provides insight into the structural properties of the galaxy, including variations in surface brightness, geometry, and potential breaks or transitions in disk morphology. This approach is particularly effective in tracing the radial variation in surface brightness, enabling the identification of transitions from high-intensity inner regions to the LSB outskirts. It provides a robust framework for analyzing structural changes and detecting extended star-forming extended disks. Such a detailed multiwavelength radial profile analysis is essential for understanding structural changes in the disk and identifying regions of extended star formation activity.
Figure 6 presents the radial surface brightness profiles of NGC 2090 across multiple wavelengths. The inner disk shows higher brightness in the longer-wavelength bands, such as the K band, consistent with a centrally concentrated, older stellar population. The K-band profile exhibits a truncation around 5 kpc, highlighting the limited radial extent of the evolved stellar component. In contrast, the FUV profile extends significantly farther, reaching out to 30 kpc, whereas the intermediate-wavelength bands (e.g., the optical g band) typically truncate around 25 kpc. Thus, the FUV emission is the most extended and indicates ongoing or recent star formation in the outer disk. It supports the inside-out formation scenario of the stellar disk in which galaxies build up their stellar disks by forming new stars preferentially at larger radii over time.
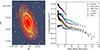 |
Fig. 6. Left: Elliptical isophotal fits on the g-band image. Right: Multiwavelength radial surface brightness profiles of NGC 2090. The dashed vertical line marks the radial extent of the galaxy as traced by the K-band emission. |
Another interesting observation from Fig. 6 is that the Spitzer band 4 continuum emission extends much farther out compared to the K-band profile, which represents old stars. It also extends beyond the stellar profile. Band 4 emission arises from dust and is possibly associated with recent star formation. So its larger radial extent also reinforces the idea that the XUV disk represents the inside-out growth of the stellar disk, which is possibly driven by gas accretion in the outer disk.
4.4.2. SFR and sSFR profile
A key signature of inside-out disk growth is the radial variation in the SFR and specific SFR (sSFR) across galactic disks. In extended XUV disk galaxies, SFR and sSFR profiles often reveal enhanced star formation activity in the outer regions, beyond the traditional optical radius (Thilker et al. 2007; Muñoz-Mateos et al. 2007a). To examine how star formation varies from the inner to the outer regions of NGC 2090, we used the radial profile information obtained from elliptical isophote fitting. We derived the radial profiles of the FUV and IRAC Channel 1 (CH1) surface brightness using elliptical isophote fitting, which were subsequently converted into SFR and stellar mass (M*), respectively. The SFRs were derived from the FUV emission profiles, while the stellar masses were estimated from the IRAC CH1 (3.6 μm) band fitting using the mass–luminosity relation  from Schombert et al. (2022). The variation of SFR and sSFR as a function of M*, is shown in Fig. 7. The SFR profile decreases with stellar mass and exhibits distinct peaks at specific radii, coinciding with the locations of the spiral arms. These peaks indicate enhanced star formation activity, likely driven by the elevated gas densities and favorable conditions along the spiral structure. Both the average SFR and stellar mass show a steady decline across the outer disk.
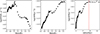 |
Fig. 7. Left: SFR as a function of M*. Middle: sSFR versus M*. Right: Radial profile of the sSFR. The dashed red line shows the R25. The x-axis in the left and middle panels corresponds to increasing radius. |
The sSFR profile as a function of stellar mass reveals that sSFR increases toward lower average stellar mass regions in the outer disk. The sSFR in the outer disk is systematically higher compared to the inner regions, shown in the right panel of Fig. 7. This suggests that, although the outer disk hosts a less average total stellar mass, it is currently experiencing more active star formation per unit mass. This is also evident from the sSFR-radius plot. The sSFR increases from inner to outer disk and saturates to a constant value in the XUV disk at around ∼8 kpc. The higher sSFR in the outer disk is consistent with the inside-out formation scenario, in which galaxies build up their stellar disks over time by forming new stars preferentially at larger radii. The growth of local star-forming galaxies has been observed on spatially resolved scales, showing that galaxies generally grow inside-out (Muñoz-Mateos et al. 2007b; Pérez et al. 2013; González Delgado et al. 2015; Pezzulli et al. 2015; García-Benito et al. 2017; Frankel et al. 2019; Amrutha et al. 2024). This result highlights the growth of the outer disk of NGC 2090 driven by recent star formation.
5. IMF variation
The Hα-to-FUV flux ratio (FHα/fλ, FUV) is used as a diagnostic for probing the upper end of the stellar IMF and recent star formation activity in galaxies (Rautio et al. 2024). In particular, when applied to XUV disks, this ratio provides insight into whether the IMF or the mode of star formation changes in the low-density, outer disk environments.
In our analysis of NGC 2090, common SFCs in the Hα and FUV images were identified by cross-matching their central positions within a 2″ radius. This radius was selected based on the ∼1″ spatial resolution of both datasets and the extended sizes of the SFCs. A smaller matching radius may miss true counterparts due to positional offsets within individual complexes, whereas a larger radius would increase the likelihood of chance matches. For each matched SFC, we calculated the Hα-to-FUV flux ratio in both the inner and outer disks. Figure 8 presents the distribution of log(FHα/fλ, FUV) for the inner and outer regions.
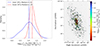 |
Fig. 8. Left: Histogram of the Hα-to-FUV flux ratio (FHα/fλ, FUV) for SFCs in the inner and outer disk. Right: Spatial variation of this flux ratio over the FUV map. The cross-matched SFCs are plotted with symbol sizes proportional to their areas and colors representing the corresponding flux ratios. |
We find that the outer disk exhibits a median flux ratio of log(FHα/fλ, FUV) ≈ 1.23, while the inner disk shows a value of ≈1.03, albeit with a larger scatter (Fig. 8, left panel). The ratio increases from inner to outer disk (Fig. 8, right panel). Rautio et al. (2024) employed STARBURST99 simulations to model this ratio for a metallicity of 0.2 Z⊙ and an upper stellar mass limit of Mu = 100 M⊙, obtaining log(FHα/fλ, FUV)≈1.14 (in units of log(Å)) for a Salpeter IMF. They further demonstrated that this ratio decreases to 0.43 for a steeper IMF slope of α = 3.3, and to 0.06 when the upper mass limit is reduced to Mu = 20 M⊙, underscoring its sensitivity to the most massive stars. The measured values are broadly consistent with expectations for a standard Salpeter IMF.
In Amrutha & Das (2025), the IMF index (α) was estimated using FUV, NUV, and Hα emissions. By using these emissions, the approximate number of O, massive B stars (B0; 21 M⊙ ≥ M* ≥ 10 M⊙) and low mass B stars (B1; 10 M⊙ ≥ M* ≥ 3 M⊙) were estimated for each SFC. Taking the ratio of the number of O to B0 stars and of B0 to B1 stars yielded two IMF indices. However, α obtained using B stars was considered reliable in the study. The equation used in Amrutha & Das (2025) to estimate IMF index (α) is
 (8)
(8)
where N(B0) and N(B1) are the estimated numbers of B0 and B1 stars. mu and ml are the upper and lower mass limits, respectively.
We used Hα and GALEX FUV and NUV data to estimate α as UVIT has only FUV observations. We convolved GALEX FUV and Hα data to GALEX NUV resolution (5.3″), the poorest resolution of all other observations. We extracted SFCs from GALEX FUV and got the flux for each SFC. We used the parameters of these SFCs and overplotted them on other bands to get the flux from them. We corrected luminosities of SFCs for internal extinction using the extinction maps as described in Sect. 4.1.2. We further used the method outlined in Amrutha & Das (2025) to get the α estimate from the B stars. For this estimation, we assumed the Hα emission comes from O8V stars, as it was shown that the α value estimated from B star ratios does not depend much on the type of O stars considered.
The median IMF slope is α = 1.74 ± 0.08 in the outer disk and α = 2.45 ± 0.06 in the inner disk (Fig. 9, left panel). The shallower slope in the outer disk implies a higher proportion of massive stars. While over 50% of the SFCs across the disk have α values between 2 and 3, several outer-disk SFCs display a top-heavy IMF, indicating an enhanced population of massive stars and suggesting that star formation in these regions is relatively recent.
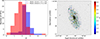 |
Fig. 9. Distribution of the IMF index (α) of SFCs over the disk of NGC 2090. Left: Histogram of the α for SFCs in the inner and outer disk. Right: Spatial variation of α over the FUV map. |
The elevated log(FHα/fν, FUV) in the outer disk, together with the comparatively shallower IMF slope (α) relative to the inner disk, indicates that massive-star formation remains efficient even in these low-density regions. This suggests that the outer disk of XUV galaxies can form a larger fraction of high-mass stars, implying that the IMF there is not truncated and may be slightly top-heavy. Outer disks are also metal-poor compared to inner regions, and metallicity plays a critical role in the thermal evolution of molecular clouds: higher metal abundances enhance cooling, leading to lower gas temperatures, and reduce the characteristic stellar mass. Consequently, metallicity is considered a key factor influencing IMF variations (Omukai 2000; Omukai et al. 2005; Schneider et al. 2006, 2012; Chiaki et al. 2014). Recent three-dimensional simulations further demonstrate that cloud fragmentation occurs once a finite metallicity is reached (Clark et al. 2008; Dopcke et al. 2011, 2013; Chiaki et al. 2016; Safranek-Shrader et al. 2016), leading to the formation of low-mass stars due to dust-induced cooling. In the metal-poor outer disk of NGC 2090, inefficient cooling may suppress fragmentation, favoring the formation of massive stars and naturally producing a top-heavy IMF. These findings underscore how environmental conditions, particularly metallicity and dust content, can modulate the stellar mass distribution in extended disks and influence galaxy-wide star formation processes.
6. Summary
Our multiwavelength analysis demonstrates that NGC 2090 is undergoing significant star formation in its extended outer disk. The detection of both FUV and Hα emission at large galactocentric radii confirms the presence of young, massive stars well beyond the central regions, while the inner disk is dominated by redder K-band emission characteristic of an older stellar population. This systematic radial gradient in stellar populations, together with the elevated sSFR in the outskirts, is consistent with inside-out disk growth, in which recent star formation increasingly contributes to stellar mass assembly at larger radii.
The FUV emission extends to ∼30 kpc, well beyond the optical disk traced by the g band, placing NGC 2090 among Type 2 XUV disk galaxies, which are characterized by blue FUV-NIR colors in optically LSB outer regions (Thilker et al. 2007). Unlike the typically diffuse UV emission seen in many Type 2 XUV disks, NGC 2090 exhibits structured FUV emission and localized Hα regions that follow spiral features in the outer disk. This spatial correspondence suggests that large-scale disk instabilities, such as spiral density waves, can propagate into the low-density outskirts and locally enhance gas densities, thereby triggering star formation even at large galactocentric distances.
In nearby spirals, the stellar disk in addition to the gas disk sets the local instability conditions (Romeo & Mogotsi 2017), with stellar self-gravity triggering perturbations that couple to the gas and promote cloud fragmentation. In NGC 2090, however, the stellar disk is confined to ∼5 kpc, while star formation extends to ∼30 kpc. This indicates that star formation in the outer disk cannot be driven by stellar-dominated instabilities, but instead likely arises from local gravitational instabilities present in a low-surface-density HI disk, turbulence-driven compression, spiral density wave perturbations, or the maintenance of marginal instability through external gas accretion. Bush et al. (2008, 2010) used hydrodynamical simulations to demonstrate that spiral density waves originating in the inner disk can propagate into the outer gaseous disk, locally enhancing gas densities above the star formation threshold and producing star-forming regions in the extended disk. While their models successfully reproduce the Type 1 XUV morphology, they fail to account for the more extended, diffuse star-forming regions seen in Type 2 XUV disks. The latter likely require additional processes such as recent gas accretion, which can replenish the outer disk with low-metallicity gas, creating conditions conducive to in situ star formation. NGC 2090 is a type 2 XUV galaxy with star formation associated with the spiral arm. This suggests that both gas accretion and spiral density wave propagation are at play: gas accretion could supply the necessary fuel, while spiral density waves could generate localized overdensities that trigger star formation in the extended, low-density outer disk.
The more confined distribution of Hα compared to FUV emission likely reflects the shorter lifetimes of ionizing OB stars, as well as the potential effects of stochastic star formation or reduced ionizing photon escape in low-density environments (Boissier et al. 2007; Werk et al. 2010). The presence of young stars in the outer disk, where the gas surface density, metallicity, and dust content are typically low, implies that star formation can proceed under suboptimal conditions. Cold gas accretion, via either minor interactions or inflow from the intergalactic medium, may supply fresh gas to the outskirts. As the accreted gas cools and becomes gravitationally unstable, spiral arm perturbations can induce local overdensities that initiate star formation, even in the LSB regions (Kereš et al. 2005; Ocvirk et al. 2008; Brooks et al. 2009; Nelson et al. 2013).
The spatial distribution of PAH emission and the 21 μm dust emission is strongly correlated with the FUV emission from SFCs, indicating a close association between dust heating, PAH excitation, and recent star formation activity. Notably, the 3.3 μm and 7.7 μm PAH features exhibit enhanced emission along the spiral arms, suggesting that PAH carriers are either more abundant or more efficiently excited in these regions. This enhancement likely reflects the influence of density waves and local UV radiation fields that are particularly intense along spiral arms, promoting both star formation and PAH emission.
The observed number and flux ratios of Hα to FUV emission in the outer disk of NGC 2090 indicate that the IMF is not truncated in the outer disk. This suggests that the high-mass end of the IMF remains fully populated even in the diffuse, low-density outskirts of the galaxy. The detection of significant Hα emission confirms the presence of ionizing O-type stars, which would be absent in a truncated IMF scenario. These results imply that star formation in the extended outer disk proceeds efficiently, sustaining massive-star formation despite the low gas densities and metallicities characteristic of these regions. These observations support the picture of NGC 2090 undergoing inside-out stellar disk growth. The coexistence of an evolved stellar population in the center and active star formation in the outskirts is consistent with results from resolved stellar population studies of nearby galaxies, which find systematically younger stars at larger galactocentric distances (Williams et al. 2009). Such extended disk star formation plays a key role in the ongoing mass assembly and morphological evolution of late-type spiral galaxies.
Acknowledgments
We thank the anonymous referee for their constructive comments, which have significantly improved the clarity and impact of this work. JY acknowledges financial support from the Spanish Ministry of Science, Innovation and Universities (Ministerio de Ciencia, Innovación y Universidades, MICIU), project PID2022-136598NBC31 (ESTALLIDOS8) by MCIN/AEI/10.13039/501100011033. DR and MD acknowledge the support of “The Royal Society Yusuf Hamied International Exchange Award” funded by The Yusuf and Farida Hamied Foundation, U.K. MD also gratefully acknowledges the support of the Department of Science and Technology (DST) grant DST/WIDUSHI-A/PM/PM/2023/25(G) for this research. This publication uses data from UVIT, which is part of the AstroSat mission of the Indian Space Research Organisation (ISRO) and is archived at the Indian Space Science Data Centre (ISSDC). We gratefully thank all the members of various teams for supporting the project from the early stages of design to launch and observations in orbit. This work is based on observations made with the NASA/ESA/CSA JWST. The data were obtained from the Mikulski Archive for Space Telescopes at the Space Telescope Science Institute, which is operated by the Association of Universities for Research in Astronomy, Inc., under NASA contract NAS 5-03127. The observations are associated with the JWST program 3707.
References
- Adams, F. C., & Fatuzzo, M. 1996, ApJ, 464, 256 [NASA ADS] [CrossRef] [Google Scholar]
- Adams, F. C., & Laughlin, G. 1996, ApJ, 468, 586 [Google Scholar]
- Allamandola, L. J., Tielens, A. G. G. M., & Barker, J. R. 1989, ApJS, 71, 733 [Google Scholar]
- Amrutha, S., & Das, M. 2025, ApJ, 987, 11 [Google Scholar]
- Amrutha, S., Das, M., & Yadav, J. 2024, MNRAS, 530, 2199 [NASA ADS] [CrossRef] [Google Scholar]
- Bakos, J., Trujillo, I., & Pohlen, M. 2008, ApJ, 683, L103 [NASA ADS] [CrossRef] [Google Scholar]
- Baron, D., Sandstrom, K. M., Rosolowsky, E., et al. 2024, ApJ, 968, 24 [NASA ADS] [CrossRef] [Google Scholar]
- Baron, D., Sandstrom, K. M., Sutter, J., et al. 2025, ApJ, 978, 135 [Google Scholar]
- Bastian, N., Covey, K. R., & Meyer, M. R. 2010, ARA&A, 48, 339 [Google Scholar]
- Bertin, E., & Arnouts, S. 1996, A&AS, 117, 393 [NASA ADS] [CrossRef] [EDP Sciences] [Google Scholar]
- Bertin, G., & Romeo, A. B. 1988, A&A, 195, 105 [NASA ADS] [Google Scholar]
- Bicalho, I. C., Combes, F., Rubio, M., Verdugo, C., & Salome, P. 2019, A&A, 623, A66 [NASA ADS] [CrossRef] [EDP Sciences] [Google Scholar]
- Bigiel, F., Leroy, A., Seibert, M., et al. 2010a, ApJ, 720, L31 [NASA ADS] [CrossRef] [Google Scholar]
- Bigiel, F., Leroy, A., Walter, F., et al. 2010b, AJ, 140, 1194 [NASA ADS] [CrossRef] [Google Scholar]
- Boissier, S., Prantzos, N., Boselli, A., & Gavazzi, G. 2003, MNRAS, 346, 1215 [NASA ADS] [CrossRef] [Google Scholar]
- Boissier, S., Gil de Paz, A., Boselli, A., et al. 2007, ApJS, 173, 524 [NASA ADS] [CrossRef] [Google Scholar]
- Brooks, A. M., Governato, F., Quinn, T., Brook, C. B., & Wadsley, J. 2009, ApJ, 694, 396 [NASA ADS] [CrossRef] [Google Scholar]
- Brown, T., & Wilson, C. D. 2019, ApJ, 879, 17 [NASA ADS] [CrossRef] [Google Scholar]
- Bush, S. J., Cox, T. J., Hernquist, L., Thilker, D., & Younger, J. D. 2008, ApJ, 683, L13 [Google Scholar]
- Bush, S. J., Cox, T. J., Hayward, C. C., et al. 2010, ApJ, 713, 780 [Google Scholar]
- Calapa, M. D., Calzetti, D., Draine, B. T., et al. 2014, ApJ, 784, 130 [NASA ADS] [CrossRef] [Google Scholar]
- Calzetti, D., Kennicutt, R. C., Engelbracht, C. W., et al. 2007, ApJ, 666, 870 [Google Scholar]
- Caplar, N., & Tacchella, S. 2019, MNRAS, 487, 3845 [NASA ADS] [CrossRef] [Google Scholar]
- Chastenet, J., Sutter, J., Sandstrom, K., et al. 2023a, ApJ, 944, L11 [NASA ADS] [CrossRef] [Google Scholar]
- Chastenet, J., Sutter, J., Sandstrom, K., et al. 2023b, ApJ, 944, L12 [NASA ADS] [CrossRef] [Google Scholar]
- Chiaki, G., Schneider, R., Nozawa, T., et al. 2014, MNRAS, 439, 3121 [NASA ADS] [CrossRef] [Google Scholar]
- Chiaki, G., Yoshida, N., & Hirano, S. 2016, MNRAS, 463, 2781 [Google Scholar]
- Chown, R., Leroy, A. K., Bolatto, A. D., et al. 2025, ApJ, 987, 91 [Google Scholar]
- Christlein, D., & Zaritsky, D. 2008, ApJ, 680, 1053 [Google Scholar]
- Clark, P. C., Glover, S. C. O., & Klessen, R. S. 2008, ApJ, 672, 757 [NASA ADS] [CrossRef] [Google Scholar]
- Cluver, M. E., Jarrett, T. H., Dale, D. A., et al. 2017, ApJ, 850, 68 [Google Scholar]
- Cortzen, I., Garrett, J., Magdis, G., et al. 2019, MNRAS, 482, 1618 [NASA ADS] [CrossRef] [Google Scholar]
- Cuillandre, J.-C., Lequeux, J., Allen, R. J., Mellier, Y., & Bertin, E. 2001, ApJ, 554, 190 [Google Scholar]
- Dabringhausen, J., Kroupa, P., & Baumgardt, H. 2009, MNRAS, 394, 1529 [Google Scholar]
- Dale, D. A., Boquien, M., Barnes, A. T., et al. 2023, ApJ, 944, L23 [NASA ADS] [CrossRef] [Google Scholar]
- Dale, D. A., Graham, G. B., Barnes, A. T., et al. 2025, AJ, 169, 133 [Google Scholar]
- Das, M., O’Neil, K., Vogel, S. N., & McGaugh, S. 2006, ApJ, 651, 853 [Google Scholar]
- Das, M., Boone, F., & Viallefond, F. 2010, A&A, 523, A63 [NASA ADS] [CrossRef] [EDP Sciences] [Google Scholar]
- Das, M., Yadav, J., Patra, N., et al. 2021, J. Astrophys. Astron., 42, 85 [Google Scholar]
- de Blok, W. J. G., & Walter, F. 2003, MNRAS, 341, L39 [Google Scholar]
- de Blok, W. J. G., van der Hulst, J. M., & Bothun, G. D. 1995, MNRAS, 274, 235 [Google Scholar]
- Dekel, A., & Birnboim, Y. 2006, MNRAS, 368, 2 [NASA ADS] [CrossRef] [Google Scholar]
- Dekel, A., Birnboim, Y., Engel, G., et al. 2009, Nature, 457, 451 [Google Scholar]
- Dessauges-Zavadsky, M., Verdugo, C., Combes, F., & Pfenniger, D. 2014, A&A, 566, A147 [NASA ADS] [CrossRef] [EDP Sciences] [Google Scholar]
- Dib, S., Kim, J., & Shadmehri, M. 2007, MNRAS, 381, L40 [NASA ADS] [CrossRef] [Google Scholar]
- Donas, J., & Deharveng, J. M. 1984, A&A, 140, 325 [NASA ADS] [Google Scholar]
- Donas, J., Milliard, B., Laget, M., & Deharveng, J. M. 1981, A&A, 97, L7 [Google Scholar]
- Dopcke, G., Glover, S. C. O., Clark, P. C., & Klessen, R. S. 2011, ApJ, 729, L3 [Google Scholar]
- Dopcke, G., Glover, S. C. O., Clark, P. C., & Klessen, R. S. 2013, ApJ, 766, 103 [NASA ADS] [CrossRef] [Google Scholar]
- Draine, B. T., Li, A., Hensley, B. S., et al. 2021, ApJ, 917, 3 [CrossRef] [Google Scholar]
- Egorov, O. V., Kreckel, K., Sandstrom, K. M., et al. 2023, ApJ, 944, L16 [NASA ADS] [CrossRef] [Google Scholar]
- Elmegreen, B. G. 2004, MNRAS, 354, 367 [NASA ADS] [CrossRef] [Google Scholar]
- Ferguson, A. M. N., Wyse, R. F. G., Gallagher, J. S., & Hunter, D. A. 1998, ApJ, 506, L19 [NASA ADS] [CrossRef] [Google Scholar]
- Figueira, M., Pollo, A., Małek, K., et al. 2022, A&A, 667, A29 [NASA ADS] [CrossRef] [EDP Sciences] [Google Scholar]
- Fitzpatrick, E. L. 1999, PASP, 111, 63 [Google Scholar]
- Flaugher, B., Diehl, H. T., Honscheid, K., et al. 2015, AJ, 150, 150 [Google Scholar]
- Frankel, N., Sanders, J., Rix, H.-W., Ting, Y.-S., & Ness, M. 2019, ApJ, 884, 99 [Google Scholar]
- Galliano, F., Madden, S. C., Tielens, A. G. G. M., Peeters, E., & Jones, A. P. 2008, ApJ, 679, 310 [Google Scholar]
- Gao, Y., Xiao, T., Li, C., et al. 2019, ApJ, 887, 172 [Google Scholar]
- Gao, Y., Tan, Q.-H., Gao, Y., et al. 2022, ApJ, 940, 133 [NASA ADS] [CrossRef] [Google Scholar]
- García-Benito, R., González Delgado, R. M., Pérez, E., et al. 2017, A&A, 608, A27 [NASA ADS] [CrossRef] [EDP Sciences] [Google Scholar]
- García-Bernete, I., Alonso-Herrero, A., Rigopoulou, D., et al. 2024, A&A, 681, L7 [NASA ADS] [CrossRef] [EDP Sciences] [Google Scholar]
- Gil de Paz, A., Madore, B. F., Boissier, S., et al. 2005, ApJ, 627, L29 [Google Scholar]
- Gil de Paz, A., Boissier, S., Madore, B. F., et al. 2007a, ApJS, 173, 185 [Google Scholar]
- Gil de Paz, A., Madore, B. F., Boissier, S., et al. 2007b, ApJ, 661, 115 [Google Scholar]
- Goddard, Q. E., Kennicutt, R. C., & Ryan-Weber, E. V. 2010, MNRAS, 405, 2791 [NASA ADS] [Google Scholar]
- González Delgado, R. M., García-Benito, R., Pérez, E., et al. 2015, A&A, 581, A103 [Google Scholar]
- Gregg, B., Calzetti, D., Adamo, A., et al. 2024, ApJ, 971, 115 [Google Scholar]
- Haydon, D. T., Kruijssen, J. M. D., Chevance, M., et al. 2020, MNRAS, 498, 235 [NASA ADS] [CrossRef] [Google Scholar]
- Herbert-Fort, S., Zaritsky, D., Christlein, D., & Kannappan, S. J. 2010, ApJ, 715, 902 [Google Scholar]
- Hopkins, A. M. 2018, PASA, 35 [Google Scholar]
- Ichikawa, K., Imanishi, M., Ueda, Y., et al. 2014, ApJ, 794, 139 [Google Scholar]
- Imanishi, M., Nakagawa, T., Ohyama, Y., et al. 2008, PASJ, 60, S489 [Google Scholar]
- Imanishi, M., Nakagawa, T., Shirahata, M., Ohyama, Y., & Onaka, T. 2010, ApJ, 721, 1233 [CrossRef] [Google Scholar]
- Inami, H., Armus, L., Matsuhara, H., et al. 2018, A&A, 617, A130 [NASA ADS] [CrossRef] [EDP Sciences] [Google Scholar]
- James, P. A., Shane, N. S., Knapen, J. H., Etherton, J., & Percival, S. M. 2005, A&A, 429, 851 [NASA ADS] [CrossRef] [EDP Sciences] [Google Scholar]
- Jansen, R. A., Fabricant, D., Franx, M., & Caldwell, N. 2000, ApJS, 126, 331 [NASA ADS] [CrossRef] [Google Scholar]
- Jedrzejewski, R. I. 1987, MNRAS, 226, 747 [Google Scholar]
- Kalari, V. M., Carraro, G., Evans, C. J., & Rubio, M. 2018, ApJ, 857, 132 [NASA ADS] [CrossRef] [Google Scholar]
- Katz, N., & Gunn, J. E. 1991, ApJ, 377, 365 [NASA ADS] [CrossRef] [Google Scholar]
- Kennicutt, R. C., Jr 1992, ApJ, 388, 310 [CrossRef] [Google Scholar]
- Kennicutt, R. C. J. R. 1998, ARA&A, 36, 189 [NASA ADS] [CrossRef] [Google Scholar]
- Kereš, D., Katz, N., Weinberg, D. H., & Davé, R. 2005, MNRAS, 363, 2 [Google Scholar]
- Koda, J., Yagi, M., Boissier, S., et al. 2012, ApJ, 749, 20 [NASA ADS] [CrossRef] [Google Scholar]
- Koopmann, R. A., & Kenney, J. D. P. 2006, ApJS, 162, 97 [NASA ADS] [CrossRef] [Google Scholar]
- Koopmann, R. A., Kenney, J. D. P., & Young, J. 2001, ApJS, 135, 125 [NASA ADS] [CrossRef] [Google Scholar]
- Kroupa, P. 2002, Science, 295, 82 [Google Scholar]
- Kroupa, P., Weidner, C., Pflamm-Altenburg, J., et al. 2013, Planets. Stars and Stellar Systems, 5, 115 [Google Scholar]
- Kumar, A., Ghosh, S. K., Hutchings, J., et al. 2012, SPIE Conf. Ser., 8443, 84431N [NASA ADS] [Google Scholar]
- Lai, T. S.-Y., Smith, J. D. T., Baba, S., Spoon, H. W. W., & Imanishi, M. 2020, ApJ, 905, 55 [NASA ADS] [CrossRef] [Google Scholar]
- Larson, R. B. 1998, MNRAS, 301, 569 [NASA ADS] [CrossRef] [Google Scholar]
- Lee, J. C., Gil de Paz, A., Tremonti, C., et al. 2009, ApJ, 706, 599 [NASA ADS] [CrossRef] [Google Scholar]
- Lelièvre, M., & Roy, J.-R. 2000, AJ, 120, 1306 [CrossRef] [Google Scholar]
- Lemonias, J. J., Schiminovich, D., Thilker, D., et al. 2011, ApJ, 733, 74 [Google Scholar]
- Leroy, A. K., Walter, F., Brinks, E., et al. 2008, AJ, 136, 2782 [Google Scholar]
- Leroy, A. K., Bigiel, F., de Blok, W. J. G., et al. 2012, AJ, 144, 3 [Google Scholar]
- Leroy, A. K., Sandstrom, K., Rosolowsky, E., et al. 2023, ApJ, 944, L9 [NASA ADS] [CrossRef] [Google Scholar]
- Li, A. 2020, Nat. Astron., 4, 339 [CrossRef] [Google Scholar]
- Lundgren, A. A., Wiklind, T., Olofsson, H., & Rydbeck, G. 2004, A&A, 413, 505 [NASA ADS] [CrossRef] [EDP Sciences] [Google Scholar]
- Maragkoudakis, A., Ivkovich, N., Peeters, E., et al. 2018, MNRAS, 481, 5370 [CrossRef] [Google Scholar]
- Maragkoudakis, A., Boersma, C., Temi, P., Bregman, J. D., & Allamandola, L. J. 2022, ApJ, 931, 38 [CrossRef] [Google Scholar]
- Marks, M., Kroupa, P., Dabringhausen, J., & Pawlowski, M. S. 2012, MNRAS, 422, 2246 [NASA ADS] [CrossRef] [Google Scholar]
- Matteucci, F. 1994, A&A, 288, 57 [NASA ADS] [Google Scholar]
- McGaugh, S. S. 1994, ApJ, 426, 135 [Google Scholar]
- Meurer, G. R., Wong, O. I., Kim, J. H., et al. 2009, ApJ, 695, 765 [NASA ADS] [CrossRef] [Google Scholar]
- Micelotta, E. R., Jones, A. P., & Tielens, A. G. G. M. 2010, A&A, 510, A36 [NASA ADS] [CrossRef] [EDP Sciences] [Google Scholar]
- Muñoz-Mateos, J. C., Gil de Paz, A., Boissier, S., et al. 2007a, ApJ, 658, 1006 [Google Scholar]
- Muñoz-Mateos, J. C., Gil de Paz, A., Boissier, S., et al. 2007b, ApJ, 658, 1006 [Google Scholar]
- Nelson, D., Vogelsberger, M., Genel, S., et al. 2013, MNRAS, 429, 3353 [NASA ADS] [CrossRef] [Google Scholar]
- Ocvirk, P., Pichon, C., & Teyssier, R. 2008, MNRAS, 390, 1326 [Google Scholar]
- Omukai, K. 2000, ApJ, 534, 809 [NASA ADS] [CrossRef] [Google Scholar]
- Omukai, K., Tsuribe, T., Schneider, R., & Ferrara, A. 2005, ApJ, 626, 627 [NASA ADS] [CrossRef] [Google Scholar]
- O’Neil, K., Bothun, G. D., & Schombert, J. 1998, AJ, 116, 2776 [Google Scholar]
- Onodera, M., Carollo, C. M., Lilly, S., et al. 2016, ApJ, 822, 42 [NASA ADS] [CrossRef] [Google Scholar]
- Pathak, D., Leroy, A. K., Thompson, T. A., et al. 2024, AJ, 167, 39 [NASA ADS] [CrossRef] [Google Scholar]
- Pedrini, A., Adamo, A., Calzetti, D., et al. 2024, ApJ, 971, 32 [Google Scholar]
- Peeters, E., Spoon, H. W. W., & Tielens, A. G. G. M. 2004, ApJ, 613, 986 [NASA ADS] [CrossRef] [Google Scholar]
- Pérez, E., Cid Fernandes, R., González Delgado, R. M., et al. 2013, ApJ, 764, L1 [Google Scholar]
- Pezzulli, G., Fraternali, F., Boissier, S., & Muñoz-Mateos, J. C. 2015, MNRAS, 451, 2324 [CrossRef] [Google Scholar]
- Postma, J. E., & Leahy, D. 2017, PASP, 129, 115002 [Google Scholar]
- Rautio, R. P. V., Watkins, A. E., Salo, H., et al. 2024, A&A, 681, A76 [NASA ADS] [CrossRef] [EDP Sciences] [Google Scholar]
- Rees, M. J., & Ostriker, J. P. 1977, MNRAS, 179, 541 [NASA ADS] [CrossRef] [Google Scholar]
- Ricca, A., Bauschlicher, C. W., Jr, Boersma, C., Tielens, A. G. G. M., & Allamandola, L. J. 2012, ApJ, 754, 75 [NASA ADS] [CrossRef] [Google Scholar]
- Rieke, M. J., Kelly, D., & Horner, S. 2005, SPIE Conf. Ser., 5904, 1 [NASA ADS] [Google Scholar]
- Rieke, G. H., Wright, G. S., Böker, T., et al. 2015, PASP, 127, 584 [NASA ADS] [CrossRef] [Google Scholar]
- Riener, M., Faesi, C. M., Forbrich, J., & Lada, C. J. 2018, A&A, 612, A81 [NASA ADS] [CrossRef] [EDP Sciences] [Google Scholar]
- Rigopoulou, D., Spoon, H. W. W., Genzel, R., et al. 1999, AJ, 118, 2625 [Google Scholar]
- Rigopoulou, D., Barale, M., Clary, D. C., et al. 2021, MNRAS, 504, 5287 [NASA ADS] [CrossRef] [Google Scholar]
- Rigopoulou, D., Donnan, F. R., García-Bernete, I., et al. 2024, MNRAS, 532, 1598 [NASA ADS] [CrossRef] [Google Scholar]
- Romeo, A. B., & Falstad, N. 2013, MNRAS, 433, 1389 [NASA ADS] [CrossRef] [Google Scholar]
- Romeo, A. B., & Fathi, K. 2015, MNRAS, 451, 3107 [NASA ADS] [CrossRef] [Google Scholar]
- Romeo, A. B., & Fathi, K. 2016, MNRAS, 460, 2360 [NASA ADS] [CrossRef] [Google Scholar]
- Romeo, A. B., & Mogotsi, K. M. 2017, MNRAS, 469, 286 [NASA ADS] [CrossRef] [Google Scholar]
- Safranek-Shrader, C., Montgomery, M. H., Milosavljević, M., & Bromm, V. 2016, MNRAS, 455, 3288 [Google Scholar]
- Salim, S., Rich, R. M., Charlot, S., et al. 2007, ApJS, 173, 267 [NASA ADS] [CrossRef] [Google Scholar]
- Sandstrom, K. M., Chastenet, J., Sutter, J., et al. 2023a, ApJ, 944, L7 [NASA ADS] [CrossRef] [Google Scholar]
- Sandstrom, K. M., Koch, E. W., Leroy, A. K., et al. 2023b, ApJ, 944, L8 [NASA ADS] [CrossRef] [Google Scholar]
- Schmitt, H. R., Calzetti, D., Armus, L., et al. 2006, ApJ, 643, 173 [NASA ADS] [CrossRef] [Google Scholar]
- Schneider, R., Omukai, K., Inoue, A. K., & Ferrara, A. 2006, MNRAS, 369, 1437 [NASA ADS] [CrossRef] [Google Scholar]
- Schneider, R., Omukai, K., Bianchi, S., & Valiante, R. 2012, MNRAS, 419, 1566 [CrossRef] [Google Scholar]
- Schneider, F. R. N., Ramírez-Agudelo, O. H., Tramper, F., et al. 2018, A&A, 618, A73 [NASA ADS] [CrossRef] [EDP Sciences] [Google Scholar]
- Schombert, J., McGaugh, S., & Lelli, F. 2022, AJ, 163, 154 [NASA ADS] [CrossRef] [Google Scholar]
- Smith, J. D. T., Draine, B. T., Dale, D. A., et al. 2007, ApJ, 656, 770 [Google Scholar]
- Springob, C. M., Haynes, M. P., Giovanelli, R., & Kent, B. R. 2005, ApJS, 160, 149 [NASA ADS] [CrossRef] [Google Scholar]
- Sutter, J., Sandstrom, K., Chastenet, J., et al. 2024, ApJ, 971, 178 [NASA ADS] [CrossRef] [Google Scholar]
- Thilker, D. A., Bianchi, L., Boissier, S., et al. 2005, ApJ, 619, L79 [Google Scholar]
- Thilker, D. A., Bianchi, L., Meurer, G., et al. 2007, ApJS, 173, 538 [Google Scholar]
- Tielens, A. G. G. M. 2008, ARA&A, 46, 289 [NASA ADS] [CrossRef] [Google Scholar]
- Ujjwal, K., Kartha, S. S., Akhil, K. R., et al. 2024, A&A, 684, A71 [NASA ADS] [CrossRef] [EDP Sciences] [Google Scholar]
- Watts, A. B., Meurer, G. R., Lagos, C. D. P., et al. 2018, MNRAS, 477, 5554 [NASA ADS] [CrossRef] [Google Scholar]
- Weisz, D. R., Johnson, B. D., Johnson, L. C., et al. 2012, ApJ, 744, 44 [NASA ADS] [CrossRef] [Google Scholar]
- Werk, J. K., Putman, M. E., Meurer, G. R., et al. 2010, AJ, 139, 279 [NASA ADS] [CrossRef] [Google Scholar]
- Whitcomb, C. M., Sandstrom, K., Leroy, A., & Smith, J.-D. T. 2023, ApJ, 948, 88 [CrossRef] [Google Scholar]
- White, S. D. M., & Rees, M. J. 1978, MNRAS, 183, 341 [Google Scholar]
- Williams, B. F., Dalcanton, J. J., Dolphin, A. E., Holtzman, J., & Sarajedini, A. 2009, ApJ, 695, L15 [NASA ADS] [CrossRef] [Google Scholar]
- Yadav, J., & Jadhav, V. V. 2024, A&A, 689, A346 [NASA ADS] [CrossRef] [EDP Sciences] [Google Scholar]
- Yadav, J., Das, M., Barway, S., & Combes, F. 2021a, A&A, 651, L9 [NASA ADS] [CrossRef] [EDP Sciences] [Google Scholar]
- Yadav, J., Das, M., Patra, N. N., et al. 2021b, ApJ, 914, 54 [Google Scholar]
- Yadav, J., Das, M., Barway, S., & Combes, F. 2022, A&A, 657, L10 [NASA ADS] [CrossRef] [EDP Sciences] [Google Scholar]
- Yadav, J., Das, M., Barway, S., & Combes, F. 2023, MNRAS, 526, 198 [Google Scholar]
- Yamada, R., Oyabu, S., Kaneda, H., et al. 2013, PASJ, 65, 103 [NASA ADS] [Google Scholar]
- Zaritsky, D., & Christlein, D. 2007, AJ, 134, 135 [Google Scholar]
- Zhang, Z.-Y., Romano, D., Ivison, R. J., Papadopoulos, P. P., & Matteucci, F. 2018, Nature, 558, 260 [Google Scholar]
- Zhang, L., Davies, R. I., Packham, C., et al. 2025, ApJS, 280, 65 [Google Scholar]
Appendix A: Supplementary figure
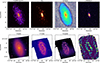 |
Fig. A.1. Multiwavelength view of NGC 2090. Top: FUV, Hα, optical g-band, and NIR 2MASS K-band images, tracing young massive stars and the underlying older stellar population. The red rectangle shows the JWST field of view. Bottom: JWST images in the F335M, F770W, and F2100W bands and CO map, highlighting PAH emission, warm dust continuum, and molecular gas, respectively. |
All Tables
All Figures
|
Fig. 1. FUV-g (left) and Spitzer IRAC CH4-CH2 (right) color maps of NGC 2090. The FUV–g map highlights the bluer spiral arms, indicative of recent star formation, while the IRAC CH4-CH2 map traces regions of bright dust and PAH emission. |
| In the text | |
|
Fig. 2. Identified SFCs in the FUV (left) and Hα (right). Blue and red symbols denote SFCs located inside and outside the optical radius, respectively, while the yellow contour marks the optical radius. The gray boxes highlight the regions shown in the inset, providing a zoomed-in view of the SFCs within those areas. |
| In the text | |
|
Fig. 3. Area (top) and ΣSFR (bottom) of SFCs in the FUV (blue) and Hα (red). |
| In the text | |
|
Fig. 4. Observed F335M image (left), the underlying stellar continuum in F335M (middle), and the isolated PAH emission component at 3.3 μm (right). |
| In the text | |
|
Fig. 5. Maps of the F335MPAH/F770W (left) and F770W/F2100W band ratios (right). |
| In the text | |
|
Fig. 6. Left: Elliptical isophotal fits on the g-band image. Right: Multiwavelength radial surface brightness profiles of NGC 2090. The dashed vertical line marks the radial extent of the galaxy as traced by the K-band emission. |
| In the text | |
|
Fig. 7. Left: SFR as a function of M*. Middle: sSFR versus M*. Right: Radial profile of the sSFR. The dashed red line shows the R25. The x-axis in the left and middle panels corresponds to increasing radius. |
| In the text | |
|
Fig. 8. Left: Histogram of the Hα-to-FUV flux ratio (FHα/fλ, FUV) for SFCs in the inner and outer disk. Right: Spatial variation of this flux ratio over the FUV map. The cross-matched SFCs are plotted with symbol sizes proportional to their areas and colors representing the corresponding flux ratios. |
| In the text | |
|
Fig. 9. Distribution of the IMF index (α) of SFCs over the disk of NGC 2090. Left: Histogram of the α for SFCs in the inner and outer disk. Right: Spatial variation of α over the FUV map. |
| In the text | |
|
Fig. A.1. Multiwavelength view of NGC 2090. Top: FUV, Hα, optical g-band, and NIR 2MASS K-band images, tracing young massive stars and the underlying older stellar population. The red rectangle shows the JWST field of view. Bottom: JWST images in the F335M, F770W, and F2100W bands and CO map, highlighting PAH emission, warm dust continuum, and molecular gas, respectively. |
| In the text | |
Current usage metrics show cumulative count of Article Views (full-text article views including HTML views, PDF and ePub downloads, according to the available data) and Abstracts Views on Vision4Press platform.
Data correspond to usage on the plateform after 2015. The current usage metrics is available 48-96 hours after online publication and is updated daily on week days.
Initial download of the metrics may take a while.