| Issue |
A&A
Volume 709, May 2026
|
|
|---|---|---|
| Article Number | A33 | |
| Number of page(s) | 12 | |
| Section | Extragalactic astronomy | |
| DOI | https://doi.org/10.1051/0004-6361/202659571 | |
| Published online | 30 April 2026 | |
Beyond compactness
A structural–dynamical–evolutionary manifold for the stellar-to-dynamical mass ratio in ultra-compact massive galaxies
European Southern Observatory, Karl-Schwarzschild-Straße 2, 85748 Garching, Germany
★ Corresponding author: This email address is being protected from spambots. You need JavaScript enabled to view it.
Received:
23
February
2026
Accepted:
18
March
2026
Abstract
Context. Ultra-compact massive galaxies (UCMGs) often exhibit elevated stellar-to-dynamical mass ratios when dynamical masses are estimated using standard virial prescriptions. This discrepancy has been interpreted as evidence for structural non-homology driven primarily by their compactness.
Aims. This study investigates how the stellar-to-dynamical mass ratio depends on compactness (𝒞), internal kinematics (σ★), stellar population properties (mass-weighted age, metallicity, and [Mg/Fe]), and star formation histories. The analysis is based on a homogeneous catalogue of 482 UCMGs from the INSPIRE and E-INSPIRE surveys, extending to significantly smaller sizes than previously analysed samples.
Methods. I first derive the compactness–mass relation assuming a constant virial coefficient (K = 5). I then correct stellar masses for initial mass function (IMF) variations and recompute stellar-to-dynamical mass ratios using an empirical prescription in which the virial coefficient varies as a function of radius and stellar mass. Finally, I test whether the relation is modulated by stellar kinematics and population properties, including the degree of relicness (DoR), which quantifies the extremeness of the star formation history.
Results. A statistically significant anti-correlation between compactness and the IMF-corrected stellar-to-dynamical mass ratio is recovered when a constant virial coefficient is adopted, even within the relatively narrow range of 𝒞 spanned by nearby UCMGs. The relation substantially flattens when a structure-dependent K is adopted, in agreement with previous literature. Beyond this one-dimensional behaviour, the data define a structural–dynamical manifold in the (log𝒞, log σ★) space. Velocity dispersion sets the dominant axis of variation, and the corresponding plane accounts for ∼62% of the variance in stellar-to-dynamical mass ratio. Including stellar age increases the explained variance to ∼63%, revealing a secondary evolutionary modulation. In contrast, DoR, metallicity, and [Mg/Fe] do not retain independent explanatory power once stellar age is included.
Conclusions. The stellar-to-dynamical mass ratio in UCMGs is governed primarily by the depth of the gravitational potential, traced by stellar velocity dispersion, rather than by compactness alone. At fixed size, systems with higher σ★ exhibit systematically lower stellar-to-dynamical mass ratio, indicating that dynamical structure regulates the apparent mass imbalance in the ultra-compact regime. Compactness largely reflects this dynamical scaling, while stellar age introduces a coherent secondary modulation linking the structural manifold to the evolutionary state of the galaxy. Non-homology in UCMGs therefore encodes coupled dynamical and assembly processes rather than purely geometric compactness.
Key words: galaxies: elliptical and lenticular / cD / galaxies: evolution / galaxies: formation / galaxies: structure
© The Authors 2026
 Open Access article, published by EDP Sciences, under the terms of the Creative Commons Attribution License (https://creativecommons.org/licenses/by/4.0), which permits unrestricted use, distribution, and reproduction in any medium, provided the original work is properly cited.
This article is published in open access under the Subscribe to Open model. This email address is being protected from spambots. You need JavaScript enabled to view it. to support open access publication.
1. Introduction
In the local Universe, early-type galaxies (ETGs) follow a network of tight scaling relations linking stellar mass, effective radius, surface brightness, and velocity dispersion, including the Faber–Jackson relation (Faber & Jackson 1976), the Fundamental Plane (Djorgovski & Davis 1987; Dressler et al. 1987), and the stellar mass–size relation (Shen et al. 2003). Modern dynamical studies have further reformulated these relations in terms of stellar and dynamical mass (virial or model), giving rise to the so-called Mass Plane (Cappellari et al. 2013; Zhu et al. 2024).
These scaling relations are commonly interpreted within the framework of virial equilibrium, where deviations from the simplest expectations are attributed to structural non-homology and variations in the stellar mass-to-light ratio (Shen et al. 2003; Cappellari et al. 2006, 2013). In the simplest homologous approximation, galaxies are assumed to share similar internal density profiles and orbital structures such that the virial coefficient K entering dynamical mass estimates can be treated as approximately constant.
For ETGs, detailed dynamical modelling has shown that a value K ≃ 5 provides an excellent approximation when the velocity dispersion (σ★) is measured within one effective radius (Cappellari et al. 2006). In this regime, the virial estimate Mdyn, vir with K = 5 closely reproduces the dynamical mass derived from full modelling, such that the stellar (M★) and dynamical masses (Mdyn) derived from full modelling are broadly consistent within observational uncertainties and systematic effects. However, analytical studies of Sérsic models have shown that the virial coefficient K is an explicit function of the Sérsic index (n), reflecting variations in the internal density structure and thereby breaking strict structural homology (Ciotti 1991; Bertin et al. 2002). Empirical and dynamical analyses confirm that fixed-K estimators systematically deviate from more sophisticated dynamical masses as a function of n (e.g. Zahid & Geller 2017; Frigo & Balcells 2017; van der Wel et al. 2022), and extended Fundamental Plane models account for structural non-homology traced by the Sérsic profile (e.g. Yehia 2025). Systematic departures from simple virial expectations have been repeatedly reported in the literature, particularly among the most compact and massive systems. Several observational studies have shown that ultra-compact massive galaxies (UCMGs) can exhibit unusually high stellar-to-dynamical mass ratios, in some cases approaching or exceeding unity (Martínez-Manso et al. 2011; Peralta de Arriba et al. 2014, 2015). Such values are difficult to reconcile with standard assumptions about galaxy structure and mass distribution, and suggest that UCMGs may deviate systematically from the dynamical manifold defined by normal-sized ETGs. Recent Integral-Field Spectroscopy (IFS) and dynamical studies further indicate that some ultra-compact systems can be strongly rotation-supported or otherwise non-spherical (e.g. Zhu et al. 2025), reinforcing the view that the virial estimator may be inadequate in such cases.
A comprehensive investigation of this issue was presented by Peralta de Arriba et al. (2014, 2015), hereafter PdA14 and PdA15 respectively, who analysed the dependence of the stellar-to-dynamical mass ratio on galaxy compactness across a heterogeneous sample of ETGs spanning a wide range of redshifts and structural properties. Compactness was quantified as the ratio between the effective radius and the size expected from the local stellar mass–size relation (Shen et al. 2003). They demonstrated that the apparent mass discrepancy is strongly correlated with compactness and showed that the relation can be largely reconciled by allowing the virial coefficient K to vary systematically with compactness. In this picture, deviations from homology, represented by a non-constant K, become the primary driver of the observed discrepancy.
At the same time, increasing observational evidence indicates that UCMGs do not constitute a homogeneous population. For instance, the INSPIRE (Spiniello et al. 2021a,b; D’Ago et al. 2023; Spiniello et al. 2024) and E-INSPIRE (Mills et al. 2025) surveys have shown that galaxies with similar (large) stellar masses and (ultra-compact) sizes can display remarkably different stellar population properties, reflecting diverse formation histories (SFHs). While some compact systems show evidence of extended or rejuvenated star formation, others appear to have formed the bulk of their stellar mass at early cosmic epochs through an intense and rapid burst, subsequently evolving with minimal structural growth. These latter systems, commonly referred to as relic galaxies (Trujillo et al. 2009), retain dense configurations, uniformly old and metal rich stellar populations, and enhanced [Mg/Fe] abundances (Trujillo et al. 2014; Ferré-Mateu et al. 2017; Spiniello et al. 2021b, 2024). They have also been shown to have a larger stellar velocity dispersion than non-relics and normal-sized ETGs of similar stellar mass (D’Ago et al. 2023; Spiniello et al. 2024).
An open question is therefore whether the structural–dynamical relation identified by PdA14 and PdA15 applies uniformly across the full compactness spectrum, or whether it changes in the extreme regime occupied by relic galaxies. In particular, the question is whether the compactness–M★/Mdyn relation depends solely on structural parameters, as implied by non-homology arguments, or if it also reflects differences in stellar population properties and assembly history.
In this work, I reproduce the compactness and stellar-to-dynamical mass analysis of PdA14 and PdA15 using a homogeneous master catalogue of ∼500 INSPIRE and E-INSPIRE UCMGs. In addition to sizes and stellar masses, the dataset includes integrated stellar kinematics and detailed stellar population parameters (mass-weighted age and metallicity, and light-weighted [Mg/Fe]1), as well as the degree of relicness (DoR), a quantitative proxy for formation timescale. This ultra-compact and homogeneous sample allows, for the first time, a systematic assessment of whether deviations from strict homology in the extreme compact regime are driven purely by structural effects, as previously proposed, or whether they are additionally modulated by internal kinematics and assembly history.
This paper is organised as follows. Section 2 describes the data, sample construction, and the derived physical parameters. In Section 3, I reproduce the compactness–dynamical mass relation. In Section 4, I examine its residual dependence on stellar populations and kinematic properties. Section 5 introduces the structural–dynamical manifold in the (log𝒞, log σ★) space and quantifies its modulation by stellar age. Finally, Section 6 discusses the physical implications of the results in the context of early galaxy assembly and relic evolution and summarises the main conclusions.
2. Data and sample
The analysis presented in this work is based on a homogeneous master catalogue constructed from the INSPIRE and E-INSPIRE surveys. The first, based on an ESO Large Program (ID: 1104.B-0370, PI: C. Spiniello), was specifically designed to spectroscopically follow up and characterise the stellar populations of red UCMGs in the nearby Universe (z < 0.5) identified via multi-band imaging (Tortora et al. 2016, 2018; Scognamiglio et al. 2020). The latter extends the original program by expanding the redshift coverage and wavelength range of INSPIRE. Both datasets are publicly available on the author’s webpage2.
2.1. The master catalogue of nearby UCMGs
The catalogue combines all objects observed and analysed in the two surveys and presented in the most recent data releases (Spiniello et al. 2024; Mills et al. 2025), for which reliable measurements of structural parameters, stellar kinematics, and stellar population properties are available. By the time of writing, it represents the largest homogeneous sample of spectroscopically confirmed UCMGs with a measured DoR currently available in the nearby Universe. The DoR is defined in INSPIRE as a continuous dimensionless parameter ranging from 0 to 1 that quantifies the assembly timescale of a galaxy’s stellar mass. It is derived from the reconstructed SFHs and combines the fraction of stellar mass formed within the first 3 Gyr after the Big Bang with the cosmic times required to assemble 75% and 99.8% of the total stellar mass. High DoR values correspond to relics, i.e. systems that formed the bulk of their stellar mass rapidly at high redshift and subsequently experienced little or no additional star formation or structural growth, while lower DoR values indicate more extended or complex SFHs.
The sample comprises 482 UCMGs in the redshift range 0.03 < z < 0.41, with effective radii (Re) smaller than 5 kpc and stellar masses larger than 3 × 10¹⁰ M⊙. It spans a broad range in DoR (0.05 < DoR < 0.89), encompassing both relic and non-relic UCMGs. These UCMGs cover mass-weighted ages between 2.3 and 12.4 Gyr, metallicities in the range −0.32 < [M/H] < +0.36, and light-weighted SSP-like abundance ratios 0 < [Mg/Fe] < 0.4. The velocity dispersions are generally high, reaching σ★ > 500 km s−1 for the highest DoR systems.
The 52 objects from INSPIRE were selected using a fixed size threshold (Re ≤ 2 kpc), while the majority of the sample, which comes from E-INSPIRE, satisfies the compactness criterion defined by Baldry et al. (2021),  . For these objects, the effective radii derived from Sloan Digital Sky Survey (SDSS) imaging were corrected to match those obtained from the higher spatial resolution data from the Kilo Degree Survey (KiDS, Kuijken et al. 2019), following the prescription in Mills et al. (2025). This ensures consistency across the combined dataset.
The effective radii of all UCMGs in the current catalogue lie well below those predicted by the local stellar mass–size relation, placing the sample firmly in the compact tail of the ETG distribution (see, e.g. Figure 1 of Mills et al. 2025). In contrast to the heterogeneous sample analysed by PdA14, which is dominated by typical SDSS ETGs, sparsely samples the most compact systems, and extends to higher redshift, INSPIRE and E-INSPIRE deliberately focus on the ultra-compact regime while restricting the analysis to the nearby Universe (z < 0.5). Hence, the combination of extreme compactness, high velocity dispersions, and diverse stellar populations on a homogeneous sample of nearby UCMGs, makes this dataset particularly well-suited to assess whether departures from strict homology are driven solely by structural effects or are additionally modulated by assembly history.
2.2. Compactness and dynamical masses
Following PdA14, galaxy compactness is quantified here as the ratio between the observed effective radius and the expected size from the local stellar mass–size relation
 (1)
(1)
Here RShen(M★) is the median size at fixed stellar mass given by Shen et al. (2003), expressed for stellar masses computed assuming a Kroupa initial mass function (IMF). Since the stellar masses from the catalogue are also derived adopting a Kroupa IMF, no additional IMF conversion is applied3. Although there are more recent mass–size calibrations (e.g. van der Wel et al. 2014; Lange et al. 2015; Mowla et al. 2019; Kawinwanichakij et al. 2021), I adopt Shen et al. (2003) for consistency with PdA14. With the above definition, by construction, galaxies with 𝒞 < 1 are more compact than the local early-type population at the same stellar mass. In physical terms, C acts as a proxy for the central mass concentration relative to typical ETGs.
Throughout this work I use the virial dynamical mass estimator
 (2)
(2)
where σ★ is the stellar velocity dispersion, Re the effective radius, G the gravitational constant, and K the virial coefficient. In the text and figures below, whenever we refer to ‘dynamical mass’ computed from the data, we explicitly mean this virial estimate, Mdyn, vir. We do not attempt to recover the true dynamical mass Mdyn that would be obtainable from full dynamical modelling (e.g. JAM or Schwarzschild methods) because such methods require spatially resolved kinematic maps that are unavailable for the full UCMG sample. Differences between Mdyn, vir and Mdyn can arise from non-homology, anisotropy, rotation, or departures from spherical symmetry (e.g. Cappellari et al. 2006; Zhu et al. 2025), and these issues motivate the empirical and robustness tests presented in Appendix A.
Integrated velocity dispersion values were measured from the INSPIRE and E-INSPIRE spectra using a full-spectrum fitting with the software PPXF (Cappellari 2017), and then corrected for aperture effects following the prescription in Cappellari et al. (2006). In detail, for INSPIRE the R50 apertures defined in the survey papers are adopted, while for SDSS spectra velocity dispersions are aperture-corrected assuming a fixed radius of 1.5″ (corresponding to half of the SDSS fibre diameter), after correcting the effective radii for the worse spatial resolution, as described in Mills et al. (2025). It is worth noting that in all cases the apertures are larger than the physical effective radii of the UCMGs. Uncertainties on virial dynamical masses were propagated from the measured uncertainties on velocity dispersion and assuming a conservative 15% on the stellar masses and 25% uncertainty on the effective radii to account for the difficulty of measuring such quantities from ground-based multi-band imaging. Further details on measurements and error estimation can be found in the INSPIRE and E-INSPIRE survey papers, as well as in the Appendix of Tortora et al. (2016). To allow a direct comparison with PdA14 and PdA15, I initially adopt their baseline assumption of a constant virial coefficient K = 5, corresponding to the homologous approximation calibrated for local ETGs (Cappellari et al. 2006). However, the impact of adopting a structure-dependent virial coefficient, as done in these papers, is explored in Section 3.2.
The derived structural properties of the whole sample are summarised in Figure 1, which shows the distribution of compactness (𝒞 = Re/RShen) and dynamical masses. As anticipated, the sample is strongly skewed towards compact systems with 𝒞 < 0.5, confirming that it predominantly probes the extreme tail of the local ETG size distribution. The median compactness is 𝒞 ≃ 0.35, with only a small fraction of objects approaching 𝒞 ∼ 0.6. The corresponding dynamical mass distribution peaks around Mdyn ∼ 8 × 10¹⁰ M⊙, extending up to ∼3 × 10¹¹ M⊙ for the most massive systems.
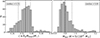 |
Fig. 1. Distribution of compactness (𝒞 = Re/RShen; left panel) and virial dynamical mass (Mdyn, K = 5; right panel) for the full sample of 482 UCMGs. Vertical dashed lines indicate the median values, while dotted lines mark the 16th and 84th percentiles. |
3. The compactness–stellar-to-dynamical mass relation
In this section, I examine how the stellar-to-dynamical mass ratio depends on compactness in the ultra-compact regime. PdA14 and PdA15 demonstrated that the apparent mass discrepancy is strongly correlated with compactness and can be largely reconciled by adopting a structure-dependent virial coefficient. In their analysis, however, stellar masses were computed assuming a fixed IMF, such that deviations from homology were interpreted primarily in terms of dynamical structure.
Here, I extend this framework by additionally accounting for IMF variations that correlate with formation history in UCMGs. Therefore, both stellar mass normalisation and dynamical mass calibration may influence the inferred compactness–M★/Mdyn relation.
3.1. IMF variations and stellar mass corrections
Recent results from the INSPIRE collaboration have demonstrated that the stellar IMF slope in UCMGs is not universal but correlates with the DoR (Martín-Navarro et al. 2023; Maksymowicz-Maciata et al. 2024). In particular, Maksymowicz-Maciata et al. (2024) derived the empirical relation
 (3)
(3)
where Γb is the low-mass IMF slope.
Adopting this calibration, variations in IMF slope are converted into stellar mass corrections via
 (4)
(4)
where Γb, Kroupa = 1.3 corresponds to a Kroupa IMF. The coefficient kIMF reflects the sensitivity of the stellar mass-to-light ratio to IMF slope variations. For old, metal-rich stellar populations typical of UCMGs, stellar population synthesis models based on the MILES library predict ∂log(M★/L)/∂Γb ∼ 0.15 − 0.20 (e.g. Vazdekis et al. 2012, 2015; Conroy & van Dokkum 2012). A representative value kIMF = 0.18 is adopted.
To avoid extrapolation beyond the calibrated regime and because no evidence is found for IMFs lighter than Kroupa in this class of systems, a conservative floor Δlog M★ ≥ 0 is imposed. Stellar masses are therefore not reduced below the Kroupa reference.
Uncertainties in IMF–DoR calibration and DoR measurements are propagated via Markov chain Monte Carlo (MCMC) sampling; the implementation details are described in Appendix B. For all subsequent analyses, the IMF-corrected stellar mass is taken as the median of the MC distribution, and stellar-to-dynamical mass ratios are computed consistently for each realisation.
Figure 2 illustrates the object-by-object stellar-mass shift induced by the IMF correction. The adjustment reaches up to ∼0.3 dex for the most extreme relic systems and is expected to influence the inferred M★/Mdyn ratios. The impact on the compactness–mass relation is examined in Section 3.3.
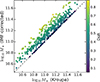 |
Fig. 2. Comparison between stellar masses derived assuming a Kroupa IMF and those corrected according to the empirical IMF–DoR relation. Points are colour-coded by DoR and the dashed line indicates the one-to-one relation. |
3.2. Structure-dependent virial coefficient
The dynamical masses derived in Section 2.2 have been computed assuming a constant virial coefficient K = 5, following the standard homologous approximation calibrated for local ETGs (Cappellari et al. 2006). However, PdA14 showed that compact massive galaxies are expected to deviate from strict structural homology and that a constant virial coefficient is therefore inadequate in this regime.
Hence, I next consider a structure-dependent virial coefficient that explicitly accounts for the dependence of the dynamical mass estimator on galaxy size and stellar mass. In this framework, the virial coefficient is parametrised as
 (5)
(5)
following Eq. (11) in PdA14.
Dynamical masses are therefore recomputed as
 (6)
(6)
allowing a direct comparison between the constant-K and structure-dependent K scenarios.
It is important to note that in this subsection the PdA coefficient is evaluated using stellar masses computed under the baseline Kroupa IMF. This choice was made to isolate the effect of structural non-homology alone, without introducing additional IMF-driven shifts. The combined effect will then be evaluated in the next section.
To visualise the magnitude of the dynamical mass shift induced by the structure-dependent virial calibration, Figure 3 directly compares the dynamical masses computed under the homologous assumption (K = 5) with those obtained using the PdA prescription. The dashed line indicates the one-to-one relation. Points are colour-coded by compactness.
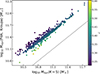 |
Fig. 3. Comparison between dynamical masses computed assuming a constant virial coefficient (K = 5) and those obtained using the structure-dependent calibration of PdA14. The dashed line indicates the one-to-one relation. Points are colour-coded by compactness. |
All systems lie systematically above the one-to-one line, indicating that the structure-dependent calibration increases the inferred dynamical mass relative to the constant-K estimate. The shift is monotonic and largest for the most compact systems, as reflected by the colour gradient. This behaviour demonstrates that deviations from structural homology introduce a substantial and compactness-dependent rescaling of the dynamical mass scale prior to analysing stellar-to-dynamical mass ratios. In the following subsection, I quantify how this structural rescaling propagates into the compactness–M★/Mdyn relation.
3.3. Impact of virial calibration on the compactness–mass relation
The consequences of adopting a structure-dependent virial coefficient and of correcting stellar mass estimates for a non-universal IMF slope are illustrated in Figure 4, which presents a three-panel comparison of the stellar-to-dynamical mass ratio as a function of compactness.
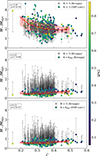 |
Fig. 4. Stellar-to-dynamical mass ratio as a function of compactness under different assumptions. In all panels, points are colour-coded by DoR, while grey symbols indicate non-corrected masses, with arrows marking correction-driven shifts. Top: IMF-corrected stellar masses with a constant virial coefficient K = 5. Middle: Structure-dependent virial coefficient K = KPdA with Kroupa stellar masses. Bottom: Fully adjusted configuration combining K = KPdA with IMF-corrected stellar masses. |
The top panel shows the IMF-corrected stellar-to-dynamical mass ratios computed under the standard homologous assumption K = 5, colour-coded by DoR. Grey symbols represent the original Kroupa-based stellar masses, with arrows indicating the IMF-driven shifts. Although IMF-driven corrections increase M★ for high-DoR systems, a high fraction of galaxies still exhibit M★/Mdyn > 1, particularly at low compactness values. This indicates that IMF variations alone are insufficient to reconcile the mass discrepancy in the ultra-compact regime.
The middle panel instead adopts the structure-dependent prescription K = KPdA, while retaining Kroupa stellar masses. Grey symbols again represent the uncorrected K = 5 ratios. Under this calibration, the previously unphysical regime M★/Mdyn > 1 is substantially reduced. This demonstrates that deviations from structural homology, encapsulated in the virial coefficient, have a major impact on the inferred dynamical mass scale. The effect of structural rescaling is significantly greater than that induced by IMF corrections alone.
In addition, a clear colour segregation is visible in this panel: at fixed compactness, high-DoR systems (yellow–green points) tend to exhibit systematically lower M★/Mdyn ratios when Kroupa stellar masses are adopted. This behaviour reflects the fact that relic-like systems are expected to host steeper IMFs, such that their stellar masses are underestimated under a universal Kroupa assumption. The structural correction alone, therefore, does not remove this population-dependent modulation.
The bottom panel combines K = KPdA with IMF-corrected stellar masses. In this fully adjusted configuration, the stellar-to-dynamical mass ratios are largely confined to a physically plausible range, with the previously extreme regime M★/Mdyn > 1 strongly suppressed, although a small number of objects still lie near or slightly above unity. The colour segregation observed in the middle panel is correspondingly reduced once IMF corrections are applied, confirming that IMF variations introduce an additional, physically motivated modulation of the mass ratio beyond structural non-homology. However, it is important to emphasise here that the PdA scaling is not derived from first-principles Jeans modelling, but represents an empirical calibration designed to restore consistency between stellar and dynamical mass estimates in the compact regime.
Taken together, these results indicate that the assumption of a constant virial coefficient K = 5, calibrated for local normal-sized homologous ETGs, is not appropriate for the ultra-compact systems probed here. Even after accounting for IMF-driven stellar mass variations, a structure-dependent virial calibration remains necessary to obtain physically consistent stellar-to-dynamical mass ratios for UCMGs.
Importantly, although adopting K = KPdA substantially reduces the previously unphysical regime M★/Mdyn > 1, it also modifies both the sign and the amplitude of the compactness trend. Under the homologous assumption (K = 5), a significant negative correlation between M★/Mdyn and 𝒞 was recovered such that more compact systems display larger stellar-to-dynamical mass ratios, in qualitative agreement with previous literature. Once KPdA is adopted, this large-scale anti-correlation largely disappears: the best-fitting relation becomes much flatter and the Spearman rank coefficient becomes small and positive for both IMF-corrected and non-corrected stellar masses. This modest but non-zero residual indicates that structural non-homology explains the bulk of the discrepancy, while a weaker dependence on compactness, or on correlated structural or dynamical quantities, remains.
To assess whether this residual trend reflects formation history or stellar population diagnostics, the next section examines the residuals from the structure-dependent fit as a function of DoR, age, [M/H], [Mg/Fe], and velocity dispersion.
4. Beyond compactness: stellar kinematic and population imprints
The previous analysis has shown that adopting a structure-dependent virial coefficient (KPdA) and correcting stellar masses for IMF variations largely removes the strong anti-correlation between M★/Mdyn and compactness that emerges under the homologous assumption (K = 5). Structural non-homology therefore accounts for the bulk of the apparent mass discrepancy in UCMGs.
Nevertheless, a residual dispersion remains around the compactness–mass relation, indicating that size alone does not provide a complete description of the stellar-to-dynamical mass ratio. Galaxies with similar compactness may differ in their internal mass concentration, assembly epoch, stellar population properties, and kinematic structure. To assess whether such parameters introduce additional systematic trends, I examine the residuals of the compactness–mass relation after removing the dependence on 𝒞.
The residuals are defined as deviations from a robust fit of
 (7)
(7)
where the fit is computed using IMF-corrected stellar masses and structure-dependent dynamical masses (K = KPdA). The residual for each galaxy is therefore defined as
![Mathematical equation: $$ \begin{aligned} \Delta \log _{10}\!\left(\frac{M_{\star ,\mathrm{IMF}}}{M_{\rm dyn,PdA}}\right) = \log _{10}\!\left(\frac{M_{\star ,\mathrm{IMF}}}{M_{\rm dyn,PdA}}\right) - \left[a+b\,\log _{10}(C)\right], \end{aligned} $$](/articles/aa/full_html/2026/05/aa59571-26/aa59571-26-eq9.gif) (8)
(8)
and quantifies the departure of each system from the mass ratio predicted solely on the basis of its compactness.
4.1. Formation history and stellar population imprint
Figure 5 explores whether stellar population properties introduce systematic modulation of the structural relation. Moderate but statistically significant trends are observed with both DoR and mass-weighted stellar age. At fixed compactness, galaxies that assembled their stellar mass earlier and more rapidly tend to exhibit systematically lower M★/Mdyn ratios than predicted by the structural fit. The residuals therefore retain an imprint of the formation epoch.
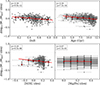 |
Fig. 5. Residuals of the compactness–mass relation, Δlog10(M★/Mdyn), as a function of stellar population and formation-history indicators: DoR (top left), mass-weighted age (top right), metallicity [M/H] (bottom left), and SSP-like [Mg/Fe] (bottom right). Grey points represent individual galaxies. Red symbols indicate binned medians with 16−84% intervals, and red lines show robust linear fits. Spearman coefficients are reported in each panel. |
No statistically significant dependence is detected with [Mg/Fe], which traces the duration of star formation episodes (Thomas et al. 2005). Since mass-weighted age and DoR encode instead the global epoch of assembly, the residual behaviour appears more closely linked to the timing of stellar mass build-up than to enrichment timescales alone. Nevertheless, it should be noted that the larger measurement uncertainties in [Mg/Fe] reduce the effective dynamic range of this diagnostic, which may partly contribute to the absence of a statistically significant correlation.
A weaker but still statistically significant correlation is found with metallicity: more metal-rich systems tend to lie slightly below the compactness-predicted relation. However, the [M/H] distribution is relatively concentrated in this sample, with the most extreme bins containing a limited number of objects. The inferred metallicity trend should therefore also be interpreted with caution.
Overall, stellar population parameters introduce a measurable but secondary modulation of the compactness–mass relation. Even after accounting for structural non-homology and IMF variations, galaxies that formed earlier retain a systematically different stellar-to-dynamical mass balance. However, these effects remain modest in amplitude relative to the intrinsic scatter of the relation.
4.2. Kinematic structure as the dominant residual axis
In contrast to moderate population trends, the most pronounced residual dependence emerges with velocity dispersion, as shown in Figure 6. A strong and highly significant anti-correlation (ρ = −0.66) is observed: galaxies with larger σ★ systematically lie below the compactness-predicted M★/Mdyn relation.
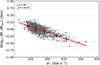 |
Fig. 6. Residuals of the compactness–mass relation as a function of central velocity dispersion σ★. Symbols and annotations follow the conventions of Fig. 5. |
Although Mdyn formally depends on σ★2, this behaviour is not a trivial algebraic consequence. Compactness already encapsulates deviations in size at fixed stellar mass, and the structure-dependent virial calibration explicitly accounts for systematic size- and mass-scaling. The persistence of a strong residual–σ★ correlation therefore indicates a genuine diversity in the internal dynamical structure among galaxies with similar compactness.
Physically, σ★ traces the depth of the gravitational potential and is directly related to the central mass distribution (Cappellari 2016). Variations in mass concentration, inner density slope, orbital anisotropy, or dark-matter fraction within the effective radius can modify the mapping between the observed line-of-sight dispersion and the total kinetic energy. Systems with higher velocity dispersions may therefore possess more centrally concentrated mass configurations than captured by the simple virial scaling, leading to a systematically lower inferred M★/Mdyn at fixed compactness.
Importantly, stellar masses have already been corrected for IMF variations (Sect. 3.1). Therefore, the strong residual–σ★ trend cannot be attributed to IMF-driven mass shifts. Instead, it reveals that internal kinematics encode structural information that is not captured by compactness alone. The strength and structural nature of the σ★ dependence indicate that internal kinematics must be treated as a primary coordinate in the mass–discrepancy relation. Compactness by itself does not define the full structural scaling of M★/Mdyn in UCMGs, motivating a multivariate description in which size and internal kinematics are considered simultaneously.
5. A structural manifold in (log𝒞, logσ★) space
The strong residual–σ★ correlation identified in Sect. 4.2 demonstrates that compactness alone does not provide a complete description of the stellar-to-dynamical mass ratio. Therefore, I quantified the joint dependence on size and internal kinematics through a multivariate regression of the form
 (9)
(9)
where σ★, corr is the aperture-corrected velocity dispersion. All coefficients were estimated using a robust M-estimator with Huber loss (Huber 1964; Huber & Ronchetti 2009). The explained variance is computed from the predictions of the robust fit as
 (10)
(10)
where Var denotes the population variance (ddof = 0), ensuring consistency with the bootstrap computation.
Table 1, where the coefficient of determination (R2) and the Root Mean Square (RMS) are computed from robust linear model (RLM) predictions, and parameter uncertainties correspond to 95% bootstrap confidence intervals (n = 1000). The compactness-only model explains only RRLM2 = 0.0547 of the variance in log10(M★, IMF/Mdyn, PdA). The inclusion of velocity dispersion increases the explained variance to RRLM2 = 0.6170, establishing the (log𝒞, log σ★) plane as the primary structural relation. The robust best-fitting coefficients are
 (11)
(11)
Robust multivariate regressions for log(M★, IMF/Mdyn, PdA).
also reported in the second line of Table 1.
The magnitude of the log σ★ coefficient is approximately eight times larger than that of log𝒞, demonstrating that internal kinematics define the dominant axis of variation. At fixed compactness, galaxies with larger velocity dispersions exhibit systematically lower stellar-to-dynamical mass ratios, whereas compactness introduces a comparatively modest geometric modulation.
For completeness, I note that an entirely empirical dynamical-mass proxy constructed directly from (log Re, log M★) and hence without any dependence on σ★ (see Appendix A), yields a qualitatively similar structural ordering, with velocity dispersion remaining the dominant predictor and compactness contributing only a secondary modulation. This confirms that the structural hierarchy is not tied to the specific choice of dynamical-mass prescription.
Figure 7 illustrates the resulting structural manifold. The data populate a well-defined tilted surface in (log𝒞, log σ★, corr) space, and the semi-transparent plane corresponds to the best-fitting robust solution of Eq. (9). Once both structural size information and internal kinematics are considered simultaneously, the stellar-to-dynamical mass ratio follows a smooth two-dimensional relation with substantially reduced scatter relative to the compactness-only description.
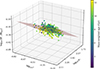 |
Fig. 7. IMF-corrected log10(M★/Mdyn) as a function of log10𝒞 and log10σ★, corr for the full UCMG sample. Points are colour-coded by mass-weighted stellar age. The semi-transparent surface shows the best-fitting robust plane obtained from Eq. (9). |
To assess potential leverage effects, I performed a leave-one-out sensitivity analysis for the structural plane. Removing galaxies with the largest absolute standardized RLM residuals produces RRLM2 values between 0.608 and 0.622, fully consistent with the full-sample result of 0.6170. The coefficients vary by less than a few percent, confirming that the dominance of σ★ is not driven by a small number of influential systems.
Because Mdyn ∝ K σ★2Re under virial equilibrium, one may ask whether the strong σ★ dependence arises trivially from algebraic coupling in the mass definition. In Appendix C.1, an MCMC shuffle test demonstrates that the observed coefficient cσ = −1.389 lies ∼18.9σ away from the null distribution expected from shuffled σ★ values (median ≃ − 0.0008, 95% CI [ − 0.147, 0.137]), confirming that the σ★ dependence is not a trivial artefact of the virial estimator.
Finally, in Appendix C.2, I verify that this result is robust to measurement uncertainties in all variables using an MCMC errors-in-variables treatment. The inferred coefficients remain consistent within 1σ of the robust fit, indicating that the measurement uncertainties do not materially alter the inferred structural scaling.
Although the structural plane accounts for most of the variance, a mild gradient in stellar age is visible across the surface. Including mass-weighted age increases the explained variance from RRLM2 = 0.6170 to RRLM2 = 0.6317, corresponding to ΔR2 = 0.0147. The fitted coefficient dAge = −0.0099 implies a modest evolutionary tilt, such that older systems exhibit slightly lower M★/Mdyn at fixed structural parameters. Figure 8 shows that the residuals from the robust structural plane exhibit a statistically significant but weak anti-correlation with stellar age (Spearman ρ = −0.278, p = 5.5 × 10⁻¹⁰), confirming a small independent modulation.
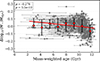 |
Fig. 8. Residuals of the robust structural plane (Eq. 9) as a function of mass-weighted stellar age. Grey points show individual galaxies. Red symbols indicate binned medians with 16−84% intervals. The Spearman coefficient is reported in the top-left corner. |
By contrast, replacing age with the DoR yields no meaningful improvement in explained variance (ΔR2 = 0.0003), and the fitted coefficient dDoR is statistically consistent with zero. Although both age and DoR trace aspects of assembly history, only mass-weighted age contributes a statistically detectable, albeit modest, independent tilt once compactness and velocity dispersion are included.
In summary, the stellar-to-dynamical mass ratio in UCMGs is primarily governed by internal kinematics. Compactness provides a secondary geometric modulation, stellar age introduces a small evolutionary tilt, and the DoR does not add independent explanatory power beyond these structural and dynamical parameters. The resulting relation is therefore best interpreted as a kinematically anchored structural manifold, with only a modest evolutionary modulation imprinted by stellar age.
6. Discussion and conclusions
The results presented in this work demonstrate that the stellar-to-dynamical mass ratio in ultra-compact massive galaxies is fundamentally governed by internal kinematics rather than by compactness alone. While compactness correlates with M★/Mdyn under a homologous virial assumption, this description becomes incomplete once velocity dispersion is included. The emergence of a structural–dynamical manifold in (log𝒞, log σ★) space indicates that the depth of the gravitational potential, traced by σ★, defines the principal axis of variation in the mass discrepancy.
In virial equilibrium, Mdyn ∝ σ★2Re for homologous systems. Deviations from a constant virial coefficient are typically interpreted as structural non-homology. However, the independent role of σ★ in multivariate regression shows that non-homology in UCMGs cannot be reduced to a pure size effect. Instead, galaxies with similar compactness may differ substantially in their internal dynamical structure, indicating diversity in central mass concentration, orbital anisotropy, or baryonic fraction within the effective radius. This diversity is consistent with the range of internal orbital configurations observed in compact systems, which can include significant rotational support and anisotropic stellar motions (e.g. Zhu et al. 2025).
The fact that the fitted log σ★ coefficient is significantly shallower than the analytic expectation associated with pure virial scaling (i.e. a slope near −2) is physically meaningful. If the σ★ dependence were purely an algebraic consequence of Mdyn ∝ σ★2Re under structural homology, a coefficient would be expected close to the analytic baseline. This comparison therefore provides a direct empirical test: if the observed relation were driven purely by the virial definition, the fitted slope should approach the algebraic expectation of −2. The significantly shallower coefficient measured here indicates that the σ★ dependence reflects genuine variations in dynamical structure rather than a trivial mathematical coupling. The observed value (cσ ≈ −1.39) therefore indicates that the effective virial coefficient is not constant across the UCMG population. In realistic galaxies the proportionality between Mdyn and σ★2Re depends on the internal mass distribution and orbital structure. Variations in the inner total mass-density slope, the degree of central baryonic concentration (including the contribution of a massive black hole), the dark-matter fraction within Re, or the orbital anisotropy can all modify the mapping between the observed line-of-sight dispersion and the total kinetic energy (e.g. Cappellari et al. 2007, 2013; Tortora et al. 2014; Dutton & Treu 2014). As a result, systems with similar compactness can exhibit different dynamical responses to increasing σ★. Disentangling these structural effects requires spatially resolved dynamical modelling capable of separating stellar, black-hole, and dark-matter contributions within Re.
UCMGs are not uniformly dynamically hot at fixed stellar mass. Systems identified as relic-like tend to host both older stellar populations and elevated velocity dispersions (Spiniello et al. 2024), consistent with deep central potentials established during rapid, dissipative early assembly (e.g. Naab et al. 2009; Oser et al. 2010). Extreme systems such as NGC 1277, characterised by very high central stellar densities and a dynamically measured supermassive black hole (van den Bosch et al. 2012; Walsh et al. 2016), illustrate how compact baryonic concentrations can significantly enhance measured dispersions at fixed global size. The absence of uniformly high dispersions across the entire UCMG population further supports the conclusion that compactness alone cannot fully describe the dynamical state and that diversity in internal structure contributes to the observed manifold.
The secondary modulation introduced by stellar age indicates that assembly history leaves a measurable imprint on the structural–dynamical relation. Although modest in amplitude compared to the dominant σ★ dependence, the age trend suggests that systems forming earlier occupy systematically different regions of the manifold. This behaviour may reflect higher central baryonic fractions or steeper inner mass profiles established during rapid early assembly, as predicted in dissipative formation scenarios (Hopkins et al. 2008, 2009; Dekel & Burkert 2014; Zolotov et al. 2015). Alternatively, residual correlations between IMF normalisation and σ★ (Spiniello et al. 2012; La Barbera et al. 2012; Spiniello et al. 2014) could contribute to the observed age dependence if IMF corrections do not fully remove population-driven mass-to-light variations. Inside-out growth processes may further modify the stellar-to-dynamical balance within fixed apertures, depending on how later accretion redistributes stellar and dark mass in the inner regions. The absence of an independent contribution from the DoR once stellar age is included implies that the relevant evolutionary information is effectively encoded in the integrated stellar age rather than in higher-order burstiness diagnostics. The mass discrepancy therefore reflects coupled variations in dynamical structure and assembly history, with present-day kinematics acting as the primary regulator.
The structural hierarchy identified here is robust against variations in modelling assumptions. The dominance of velocity dispersion is recovered under both a constant virial prescription and the structure-dependent calibration of PdA14, and remains stable regardless of whether IMF-driven stellar mass corrections are applied or not. These tests indicate that the structural–dynamical manifold is not an artefact of a particular mass normalisation, but a genuine property of the ultra-compact regime.
Taken together, these findings imply that non-homology in UCMGs encodes dynamical diversity rather than purely geometric compactness. The stellar-to-dynamical mass ratio in the ultra-compact regime is best interpreted as the outcome of coupled structural and assembly processes, with internal kinematics providing the dominant coordinate of variation.
The main results of this study can be summarised as follows:
-
Compactness alone does not fully determine the stellar-to-dynamical mass ratio in ultra-compact massive galaxies. Although size correlates with M★/Mdyn under a homologous virial assumption, this description becomes incomplete once internal kinematics are taken into account.
-
A multivariate regression in the (log𝒞, log σ★) space accounts for 61.7% of the variance in log10(M★, IMF/Mdyn, PdA). The scaling is driven primarily by velocity dispersion, indicating that internal kinematics, rather than size alone, regulate the stellar-to-dynamical mass balance in the ultra-compact regime. At fixed compactness, systems with deeper central potentials systematically exhibit lower M★/Mdyn.
-
Stellar age introduces a secondary but coherent evolutionary tilt. Galaxies that assembled earlier tend to occupy regions associated with deeper central potentials, linking the present-day dynamical structure to early assembly processes.
-
By contrast, higher-order diagnostics, such as the DoR, metallicity, and [Mg/Fe], do not provide independent constraints once size, kinematics, and stellar age are included. The dominant evolutionary information is therefore effectively encoded in the global assembly epoch traced by stellar age.
Taken together, these results define a structural–dynamical–evolutionary manifold in which compactness reflects global size scaling, velocity dispersion anchors the depth of the gravitational potential, and stellar age introduces a modest evolutionary modulation.
Future progress in this field requires spatially resolved dynamical constraints capable of disentangling the relative contributions of stellar mass, dark matter, orbital anisotropy, and central black holes within one effective radius. Given the incredibly small apparent sizes of these objects, adaptive-optics-assisted integral-field spectroscopy on 8−10 m class telescopes, and forthcoming facilities such as the Extremely Large Telescope (ELT), are essential to resolve the inner kinematic structure of UCMGs at sub-kiloparsec scales. Such data will allow direct measurement of inner mass-density slopes and central mass concentrations, providing decisive tests of whether the observed structural–dynamical manifold reflects variations in baryonic dominance, dark-matter fraction, or black-hole mass fraction.
On the theoretical side, cosmological simulations with sufficient spatial resolution to track dissipative assembly and subsequent structural evolution are required to determine whether the coupled structural–dynamical–evolutionary manifold identified here arises naturally from specific formation pathways or reflects a more universal attractor in the ultra-compact regime.
Acknowledgments
The author wishes to thank Dr. Crescenzo Tortora, Prof. Michele Cappellari, and Prof. Ortwin Gerhard for interesting discussions.
References
- Baldry, I. K., Sullivan, T., Rani, R., & Turner, S. 2021, MNRAS, 500, 1557 [Google Scholar]
- Bertin, G., Ciotti, L., & Del Principe, M. 2002, A&A, 386, 149 [CrossRef] [EDP Sciences] [Google Scholar]
- Cappellari, M. 2016, ARA&A, 54, 597 [Google Scholar]
- Cappellari, M. 2017, MNRAS, 466, 798 [Google Scholar]
- Cappellari, M., Bacon, R., Bureau, M., et al. 2006, MNRAS, 366, 1126 [Google Scholar]
- Cappellari, M., Emsellem, E., Bacon, R., et al. 2007, MNRAS, 379, 418 [Google Scholar]
- Cappellari, M., Scott, N., Alatalo, K., et al. 2013, MNRAS, 432, 1709 [Google Scholar]
- Ciotti, L. 1991, A&A, 249, 99 [NASA ADS] [Google Scholar]
- Conroy, C., & van Dokkum, P. 2012, ApJ, 747, 69 [Google Scholar]
- D’Ago, G., Spiniello, C., Coccato, L., et al. 2023, A&A, 672, A17 [NASA ADS] [CrossRef] [EDP Sciences] [Google Scholar]
- Dekel, A., & Burkert, A. 2014, MNRAS, 438, 1870 [Google Scholar]
- Djorgovski, S., & Davis, M. 1987, ApJ, 313, 59 [Google Scholar]
- Dressler, A., Lynden-Bell, D., Burstein, D., et al. 1987, ApJ, 313, 42 [Google Scholar]
- Dutton, A. A., & Treu, T. 2014, MNRAS, 438, 3594 [NASA ADS] [CrossRef] [Google Scholar]
- Faber, S. M., & Jackson, R. E. 1976, ApJ, 204, 668 [Google Scholar]
- Ferré-Mateu, A., Trujillo, I., Martín-Navarro, I., et al. 2017, MNRAS, 467, 1929 [NASA ADS] [Google Scholar]
- Frigo, M., & Balcells, M. 2017, MNRAS, 469, 2184 [Google Scholar]
- Hopkins, P. F., Hernquist, L., Cox, T. J., Dutta, S. N., & Rothberg, B. 2008, ApJ, 679, 156 [NASA ADS] [CrossRef] [Google Scholar]
- Hopkins, P. F., Cox, T. J., Dutta, S. N., et al. 2009, ApJS, 181, 135 [NASA ADS] [CrossRef] [Google Scholar]
- Huber, P. J. 1964, Ann. Math. Stat., 35, 73 [CrossRef] [Google Scholar]
- Huber, P. J., & Ronchetti, E. M. 2009, Robust Statistics, 2nd edn. (Hoboken: Wiley) [Google Scholar]
- Kawinwanichakij, L., Silverman, J. D., Ding, X., et al. 2021, ApJ, 921, 38 [NASA ADS] [CrossRef] [Google Scholar]
- Kuijken, K., Heymans, C., Dvornik, A., et al. 2019, A&A, 625, A2 [NASA ADS] [CrossRef] [EDP Sciences] [Google Scholar]
- La Barbera, F., Ferreras, I., de Carvalho, R. R., et al. 2012, MNRAS, 426, 2300 [Google Scholar]
- Lange, R., Driver, S. P., Robotham, A. S. G., et al. 2015, MNRAS, 447, 2603 [CrossRef] [Google Scholar]
- Maksymowicz-Maciata, M., Spiniello, C., Martín-Navarro, I., et al. 2024, MNRAS, 531, 2864 [Google Scholar]
- Martínez-Manso, J., Del Olmo, A., Varela, J., et al. 2011, MNRAS, 415, L24 [Google Scholar]
- Martín-Navarro, I., Spiniello, C., Tortora, C., et al. 2023, MNRAS, 521, 1408 [CrossRef] [Google Scholar]
- Mills, J., Spiniello, C., Sergeyev, A., et al. 2025, MNRAS, 541, 2440 [Google Scholar]
- Mowla, L., van der Wel, A., van Dokkum, P., & Miller, T. B. 2019, ApJ, 872, L13 [NASA ADS] [CrossRef] [Google Scholar]
- Naab, T., Johansson, P. H., & Ostriker, J. P. 2009, ApJ, 699, L178 [Google Scholar]
- Oser, L., Ostriker, J. P., Naab, T., Johansson, P. H., & Burkert, A. 2010, ApJ, 725, 2312 [Google Scholar]
- Peralta de Arriba, L., Balcells, M., Falcón-Barroso, J., & Trujillo, I. 2014, MNRAS, 440, 1634 [Google Scholar]
- Peralta de Arriba, L., Balcells, M., Trujillo, I., & Falcón-Barroso, J. 2015, MNRAS, 453, 704 [Google Scholar]
- Scognamiglio, D., Tortora, C., Spavone, M., et al. 2020, ApJ, 893, 4 [Google Scholar]
- Shen, S., Mo, H. J., White, S. D. M., et al. 2003, MNRAS, 343, 978 [NASA ADS] [CrossRef] [Google Scholar]
- Spiniello, C., Trager, S. C., Koopmans, L. V. E., & Chen, Y. P. 2012, ApJ, 753, L32 [Google Scholar]
- Spiniello, C., Trager, S., Koopmans, L. V. E., & Conroy, C. 2014, MNRAS, 438, 1483 [Google Scholar]
- Spiniello, C., Tortora, C., D’Ago, G., et al. 2021a, A&A, 646, A28 [EDP Sciences] [Google Scholar]
- Spiniello, C., Tortora, C., D’Ago, G., et al. 2021b, A&A, 654, A136 [NASA ADS] [CrossRef] [EDP Sciences] [Google Scholar]
- Spiniello, C., D’Ago, G., Coccato, L., et al. 2024, MNRAS, 527, 8793 [Google Scholar]
- Thomas, D., Maraston, C., Bender, R., & Mendes de Oliveira, C. 2005, ApJ, 621, 673 [Google Scholar]
- Tortora, C., La Barbera, F., Napolitano, N. R., et al. 2014, MNRAS, 445, 115 [NASA ADS] [CrossRef] [Google Scholar]
- Tortora, C., La Barbera, F., Napolitano, N. R., et al. 2016, MNRAS, 457, 2845 [NASA ADS] [CrossRef] [Google Scholar]
- Tortora, C., Napolitano, N. R., Spavone, M., et al. 2018, MNRAS, 481, 4728 [Google Scholar]
- Trujillo, I., Cenarro, A. J., de Lorenzo-Cáceres, A., et al. 2009, ApJ, 692, L118 [NASA ADS] [CrossRef] [Google Scholar]
- Trujillo, I., Ferré-Mateu, A., Balcells, M., Vazdekis, A., & Sánchez-Blázquez, P. 2014, ApJ, 780, L20 [Google Scholar]
- van den Bosch, R. C. E., Gebhardt, K., Gültekin, K., et al. 2012, Nature, 491, 729 [NASA ADS] [CrossRef] [Google Scholar]
- van der Wel, A., Franx, M., van Dokkum, P. G., et al. 2014, ApJ, 788, 28 [Google Scholar]
- van der Wel, A., van Houdt, J., Bezanson, R., et al. 2022, ApJ, 936, 9 [NASA ADS] [CrossRef] [Google Scholar]
- Vazdekis, A., Ricciardelli, E., Cenarro, A. J., et al. 2012, MNRAS, 424, 157 [Google Scholar]
- Vazdekis, A., Coelho, P., Cassisi, S., et al. 2015, MNRAS, 449, 1177 [Google Scholar]
- Walsh, J. L., van den Bosch, R. C. E., Gebhardt, K., et al. 2016, ApJ, 817, 2 [NASA ADS] [CrossRef] [Google Scholar]
- Yehia, T. 2025, Ap&SS, 370, 122 [Google Scholar]
- Zahid, H. J., & Geller, M. J. 2017, ApJ, 841, 32 [NASA ADS] [CrossRef] [Google Scholar]
- Zhu, K., Lu, S., Cappellari, M., et al. 2024, MNRAS, 527, 706 [Google Scholar]
- Zhu, L., Chies-Santos, A. L., Moura, M. T., & Shi, H. 2025, A&A, 698, A195 [NASA ADS] [CrossRef] [EDP Sciences] [Google Scholar]
- Zolotov, A., Dekel, A., Mandelker, N., et al. 2015, MNRAS, 450, 2327 [Google Scholar]
The [Mg/Fe] ratios are measured from index-index plots using grids of single-stellar population (SSP) indices. They are thus hereafter defined ‘SSP-like’.
In PdA14, the authors apply a correction to consider masses computed assuming a Salpeter-like IMF instead.
Appendix A: Empirical dynamical mass estimator
To complement the principal analysis based on the structure-dependent virial estimator (Mdyn, PdA), in this Appendix I examine whether the structural–dynamical trends derived in Sec. 5 are preserved when adopting an entirely empirical dynamical-mass proxy. For this purpose, I construct a non-virial estimator, Mdyn, fit, obtained from a robust regression between log(M★/Mdyn, K = 5) and (log Re, log M★), and then re-evaluate the structural relations using consistently IMF-corrected stellar masses. Although this estimator contains no explicit dependence on σ★, it provides a useful diagnostic for assessing the stability of the structural manifold under changes in the assumed dynamical-mass prescription.
First, Figure A.1 shows the resulting compactness trends when using Kroupa-like IMF (top panel) or IMF-corrected (bot panel) stellar masses. As in Figure 4, the grey points indicate the K = 5 baseline while coloured points correspond to M★/Mdyn, fit. The thin vertical connectors highlight the object-by-object shift between the baseline and the adopted mass definition. Fixed-width binned medians and 16–84% intervals are overplotted in red, and the full-height colour bar encodes the DoR.
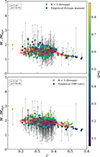 |
Fig. A.1. Empirical dynamical mass estimator versus compactness. In the top panel the empirical estimator is built using Kroupa IMF for the stellar masses, while in the bottom I apply the correction presented in the main body of the paper. Colour and symbol scheme as in Figure 4. |
When recomputing the manifold with the new empirical dynamical mass estimator, the relation retains a measurable dependence on both compactness and velocity dispersion, despite the total absence of σ★ in the definition of Mdyn, fit.
Fitting the model in Eq. 9 to the empirical estimator, with a robust Huber–loss regression, I obtain:

where the uncertainties are the 16–84% bootstrap percentiles (n = 1000).
The empirical-estimator plane explains a non-negligible fraction of the variance (RRLM2 ≃ 0.378), although much weaker than the PdA-based relation, as expected from the absence of σ★ in Mdyn, fit. However, and most importantly, the structural hierarchy is maintained: the unique contribution of velocity dispersion partial R2(σ|𝒞)≃0.227 exceeds that of compactness partial R2(𝒞|σ)≃0.084. Residual correlations with age remain weak (ρ = −0.078, p = 0.085), while DoR shows a moderate trend (ρ = 0.223, p = 7.9 × 10⁻⁷), consistent with the fact that the empirical estimator does not encode the structural non-homology captured by the PdA formalism.
The behaviour of the IMF-corrected estimator in Fig. A.1 parallels that seen in Figs. 5 and 6: the compactness dependence, scatter behaviour, and population-residual trends remain qualitatively unchanged. The structural–dynamical manifold therefore does not rely on the PdA dynamical-mass prescription; its qualitative structure persists even when a non-virial, data-driven mass proxy is adopted.
Appendix B: Propagation of IMF uncertainties
The IMF–DoR calibration adopted in this work was derived by Maksymowicz-Maciata et al. (2024) using the so-called “Golden Sample”, consisting of 39 uncontaminated, old INSPIRE galaxies selected after inspection of index–index diagnostics and removal of objects with contaminated spectral indices (see their Appendix A and the diamond symbols in their Figures 4 and 6). The resulting fit therefore reflects the IMF behaviour measured in the highest-quality INSPIRE spectra and provides the empirical calibration applied here.
To propagate uncertainties in both the IMF–DoR calibration and the measured DoR values, a Monte Carlo approach was adopted. For each galaxy, NMC = 2000 realisations were generated. The DoR value was perturbed assuming a Gaussian distribution centred on the measured value, with dispersion equal to the quoted 1σ uncertainty reported by Maksymowicz-Maciata et al. (2024).
The IMF–DoR relation was treated as
 (B.1)
(B.1)
with coefficients a and b sampled independently from Gaussian distributions centred on their nominal values and with dispersions equal to their reported 1σ uncertainties.
For each realization, the logarithmic stellar-mass correction was computed as
 (B.2)
(B.2)
where kIMF was likewise sampled within its adopted uncertainty range. A lower bound Δlog M★ ≥ 0 was imposed to prevent extrapolation towards IMFs lighter than Kroupa.
The corrected stellar mass was then obtained as
 (B.3)
(B.3)
For all analyses in the main text, the IMF-corrected stellar mass was taken as the median of the Monte Carlo distribution, with uncertainties quoted from the 16th–84th percentile range. Stellar-to-dynamical mass ratios were evaluated for each realization, ensuring consistent propagation of IMF-driven uncertainties throughout the analysis.
Appendix C: Robustness tests of the structural–dynamical manifold
The structural–dynamical manifold identified in Section 5 rests on the dominant role of the σ★ coefficient in the multivariate regression. To ensure that this result is not driven by formal properties of the virial definition or by measurement uncertainties, two complementary robustness tests were performed. The first addresses potential algebraic coupling inherent in the dynamical mass estimator, while the second evaluates the impact of propagated observational errors.
C.1. Robustness of the σ★ dependence to algebraic coupling
Because dynamical mass estimates satisfy Mdyn ∝ Kσ★2Re, algebraic covariance can in principle induce a dependence of log(M★/Mdyn) on log σ★. To ensure that the dominant σ★ coefficient measured in Section 5 does not arise trivially from this identity, two complementary tests were performed.
First, under the null hypothesis that stellar mass is uncorrelated with (σ★, Re), the expected slope of log(M★/Mdyn) versus log σ★ is approximately −2 (modulo the exact sample distribution and the adopted virial coefficient).
Second, a Monte Carlo shuffle test was conducted. The IMF-corrected stellar masses were randomly permuted among galaxies while preserving the marginal distributions of M★, σ★, and Re. For each realization, the Peralta de Arriba (PdA) virial coefficient KPdA(Re, M★) was recomputed, Mdyn and the ratio M★/Mdyn were recalculated, and the same robust multivariate model used in the main text was refitted. Results are based on N = 1000 realisations (seed fixed).
The null distribution of the fitted σ★ coefficient has mean ⟨cσ⟩= − 2.09 and standard deviation σnull ≃ 0.08. The observed coefficient, cσobs = −1.389 ± 0.056, lies ≃9σ away from the shuffle mean. The fraction of realisations producing a coefficient as shallow as the observed value is effectively zero (empirical upper bound p < 1/(N + 1)≲10−3 for N = 1000). The dominance of σ★ reported in Sect. 5 is therefore not an algebraic artefact of the virial estimator, but reflects genuine structural–dynamical coupling.
C.2. Robustness of the structural plane to measurement uncertainties
In Sect. 5, the structural manifold relating the stellar-to-dynamical mass ratio to compactness and velocity dispersion was fitted using a robust Huber-loss estimator. Because all three quantities are derived from measured observables and carry non-negligible uncertainties, the inferred regression coefficients could in principle be affected by errors-in-variables (EIV) bias.
In particular, both C and Mdyn depend on the effective radius Re, while the virial estimator satisfies Mdyn ∝ σ★2Re, introducing covariance between predictors and response. Although Appendix C.1 demonstrates that the dominant σ★ dependence is not a trivial algebraic consequence of the virial definition, it remains necessary to verify that measurement uncertainties do not materially alter the inferred slopes.
To assess this, a Monte Carlo EIV analysis was performed. For each galaxy, the observed quantities log C, log σ★, and log10(M★/Mdyn) were perturbed assuming Gaussian measurement uncertainties. Uncertainties on log σ★ were propagated as
 (C.1)
(C.1)
Uncertainties on log10(M★/Mdyn) were obtained by combining in quadrature the IMF-driven stellar-mass uncertainties and the propagated dynamical-mass uncertainty, dominated by the σ★2 term. Compactness uncertainties were propagated from the effective-radius measurements.
A total of N = 4000 realisations were generated for the full sample (Ngal = 482). In each realization, perturbed values were drawn and the linear model
 (C.2)
(C.2)
was refitted using ordinary least squares.
The median coefficients and 68% intervals are a = 2.56 ± 0.13, b = 0.21 ± 0.05, and c = −1.14 ± 0.06. For comparison, the robust RLM fit reported in Section 5 yielded a = 3.15, b = 0.17, and c = −1.39.
Accounting for measurement uncertainties modestly reduces the absolute value of the log σ★ coefficient and increases its uncertainty, as expected from regression dilution. However, the qualitative structure of the relation remains unchanged: the σ★ term continues to dominate over compactness in absolute magnitude, and its 68% interval remains well separated from zero.
In all realisations, |c|> |b|, confirming that internal kinematics remains the primary axis of variation even after propagating observational uncertainties. The structural–dynamical manifold is therefore robust to measurement-error effects.
All Tables
All Figures
|
Fig. 1. Distribution of compactness (𝒞 = Re/RShen; left panel) and virial dynamical mass (Mdyn, K = 5; right panel) for the full sample of 482 UCMGs. Vertical dashed lines indicate the median values, while dotted lines mark the 16th and 84th percentiles. |
| In the text | |
|
Fig. 2. Comparison between stellar masses derived assuming a Kroupa IMF and those corrected according to the empirical IMF–DoR relation. Points are colour-coded by DoR and the dashed line indicates the one-to-one relation. |
| In the text | |
|
Fig. 3. Comparison between dynamical masses computed assuming a constant virial coefficient (K = 5) and those obtained using the structure-dependent calibration of PdA14. The dashed line indicates the one-to-one relation. Points are colour-coded by compactness. |
| In the text | |
|
Fig. 4. Stellar-to-dynamical mass ratio as a function of compactness under different assumptions. In all panels, points are colour-coded by DoR, while grey symbols indicate non-corrected masses, with arrows marking correction-driven shifts. Top: IMF-corrected stellar masses with a constant virial coefficient K = 5. Middle: Structure-dependent virial coefficient K = KPdA with Kroupa stellar masses. Bottom: Fully adjusted configuration combining K = KPdA with IMF-corrected stellar masses. |
| In the text | |
|
Fig. 5. Residuals of the compactness–mass relation, Δlog10(M★/Mdyn), as a function of stellar population and formation-history indicators: DoR (top left), mass-weighted age (top right), metallicity [M/H] (bottom left), and SSP-like [Mg/Fe] (bottom right). Grey points represent individual galaxies. Red symbols indicate binned medians with 16−84% intervals, and red lines show robust linear fits. Spearman coefficients are reported in each panel. |
| In the text | |
|
Fig. 6. Residuals of the compactness–mass relation as a function of central velocity dispersion σ★. Symbols and annotations follow the conventions of Fig. 5. |
| In the text | |
|
Fig. 7. IMF-corrected log10(M★/Mdyn) as a function of log10𝒞 and log10σ★, corr for the full UCMG sample. Points are colour-coded by mass-weighted stellar age. The semi-transparent surface shows the best-fitting robust plane obtained from Eq. (9). |
| In the text | |
|
Fig. 8. Residuals of the robust structural plane (Eq. 9) as a function of mass-weighted stellar age. Grey points show individual galaxies. Red symbols indicate binned medians with 16−84% intervals. The Spearman coefficient is reported in the top-left corner. |
| In the text | |
|
Fig. A.1. Empirical dynamical mass estimator versus compactness. In the top panel the empirical estimator is built using Kroupa IMF for the stellar masses, while in the bottom I apply the correction presented in the main body of the paper. Colour and symbol scheme as in Figure 4. |
| In the text | |
Current usage metrics show cumulative count of Article Views (full-text article views including HTML views, PDF and ePub downloads, according to the available data) and Abstracts Views on Vision4Press platform.
Data correspond to usage on the plateform after 2015. The current usage metrics is available 48-96 hours after online publication and is updated daily on week days.
Initial download of the metrics may take a while.