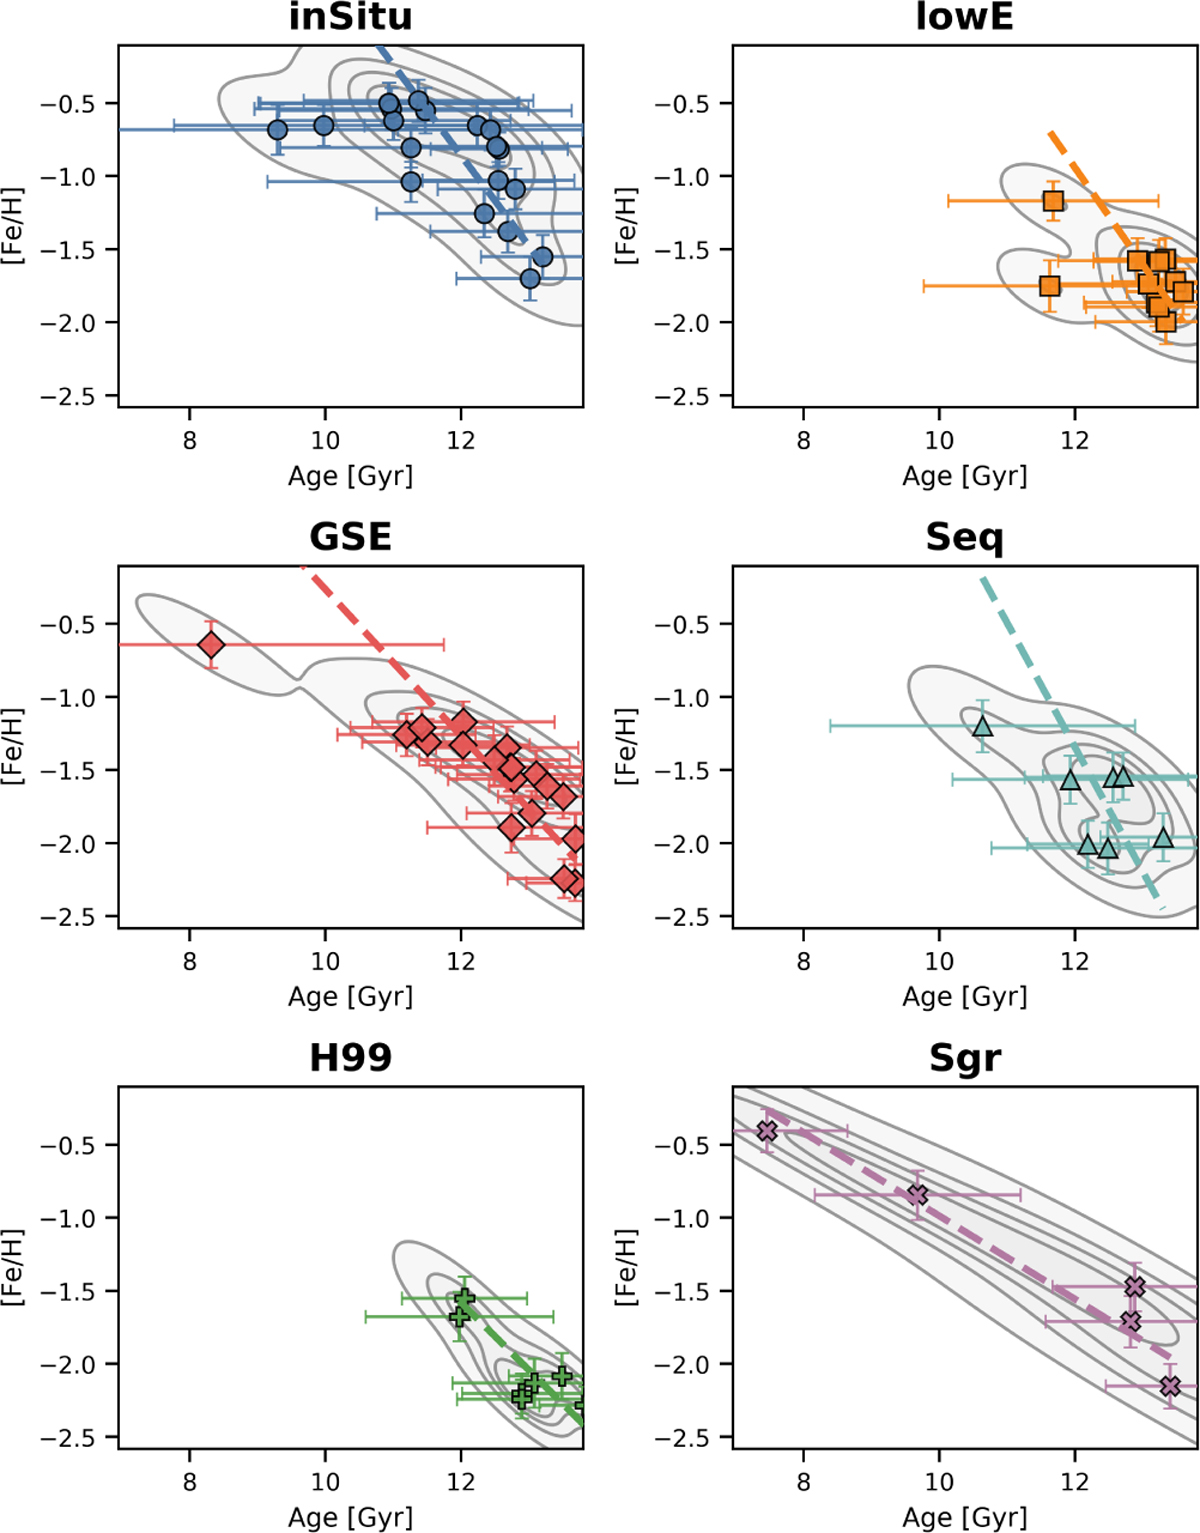
Fig. 3
Download original image
AMRs for the final merged progenitor groups. Each panel shows individual GCs (points) with asymmetric age and metallicity uncertainties. Grey-shaded kernel-density contours highlight the main population distribution, and the orthogonal distance regression linear fit (dashed line) accounts for errors in both variables. The linear fits provide a visual diagnostic of the overall AMR trend within each progenitor; however, they should not be interpreted as physical enrichment rates, as the inferred slopes depend sensitively on the sampled age range.
Current usage metrics show cumulative count of Article Views (full-text article views including HTML views, PDF and ePub downloads, according to the available data) and Abstracts Views on Vision4Press platform.
Data correspond to usage on the plateform after 2015. The current usage metrics is available 48-96 hours after online publication and is updated daily on week days.
Initial download of the metrics may take a while.