| Issue |
A&A
Volume 709, May 2026
|
|
|---|---|---|
| Article Number | A280 | |
| Number of page(s) | 13 | |
| Section | Galactic structure, stellar clusters and populations | |
| DOI | https://doi.org/10.1051/0004-6361/202659820 | |
| Published online | 25 May 2026 | |
Chemo-dynamical reconstruction of Milky Way globular cluster progenitors: Age–metallicity relations and the universality of multiple stellar populations
1
Dipartimento di Fisica e Astronomia “Augusto Righi”–Università di Bologna,
via Piero Gobetti 93/2,
40129
Bologna,
Italy
2
INAF – Osservatorio di Astrofisica e Scienza dello Spazio di Bologna,
via Piero Gobetti 93/3,
40129
Bologna,
Italy
3
Berkeley Center for Cosmological Physics and Department of Physics, University of California,
Berkeley,
CA
94720,
USA
4
ICC, University of Barcelona,
Martí i Franquès, 1,
E08028
Barcelona,
Spain
5
ICREA,
Pg. Lluis Companys 23,
Barcelona
08010,
Spain
★ Corresponding author: This email address is being protected from spambots. You need JavaScript enabled to view it.
Received:
12
March
2026
Accepted:
17
April
2026
Abstract
Context. Globular clusters encode the hierarchical assembly history of the Milky Way and the internal physics of multiple stellar populations. Reconstructing progenitor-specific age–metallicity relations requires stellar parameters free from helium-driven age biases, yet whether multiple-population properties carry an environmental imprint remains an open question.
Aims. We reconstructed progenitor-specific age–metallicity relations for 69 Galactic globular clusters using homogeneous stellar parameters derived while modelling multiple stellar populations, and tested whether helium-related multiple-population properties depend on progenitor origin once cluster mass and metallicity are controlled for.
Methods. Ages, helium spreads (δY), mean helium abundances (Ȳ), and first-population fractions (fP1) were drawn from hierarchical Bayesian colour–magnitude diagram modelling. Progenitor families were identified via probabilistic chemo-dynamical clustering, age–metallicity relations reconstructed within a hierarchical Bayesian framework, and multiple-population indicators tested for environmental dependence using regression models with sensitivity tests.
Results. Enrichment timescales are broadly consistent with τ ≲ 2 Gyr, though individual progenitors prefer shorter values when fitted independently and inter-progenitor differences cannot be resolved at the present sample size. The primary distinction is the extent of chemical evolution: most systems reach Δ[Fe/H] ≃ 1.1–1.3 dex, while Sagittarius achieves Δ[Fe/H] ≃ 1.6 dex and higher terminal metallicities. Progenitor masses identify Gaia–Sausage–Enceladus and low-energy group Nas the dominant events. Neither δY nor Ȳ shows a significant progenitor dependence, and the mass multiple-population scaling is indistinguishable across in situ and accreted systems; Sequoia clusters alone show higher fP1 at fixed mass and metallicity.
Conclusions. Age–metallicity relations carry fossil signatures of the chemical evolution and mass hierarchy of progenitor galaxies. The extent of enrichment, but not its pace, distinguishes progenitor systems. Helium enrichment amplitude is primarily regulated by cluster mass and blind to environment, pointing to universal cluster-scale formation physics. The sole robust exception of a residual progenitor dependence is in fP1, suggesting the enriched-star fraction retains a secondary environmental imprint.
Key words: methods: statistical / stars: abundances / Galaxy: evolution / Galaxy: formation / Galaxy: general / globular clusters: general
© The Authors 2026
 Open Access article, published by EDP Sciences, under the terms of the Creative Commons Attribution License (https://creativecommons.org/licenses/by/4.0), which permits unrestricted use, distribution, and reproduction in any medium, provided the original work is properly cited.
This article is published in open access under the Subscribe to Open model. This email address is being protected from spambots. You need JavaScript enabled to view it. to support open access publication.
1 Introduction
Globular clusters (GCs) occupy a unique position among tracers of galaxy assembly: they form predominantly at high redshifts (Padoan et al. 1997; Trenti et al. 2015), survive for a Hubble time, and carry in their stellar populations both the chemical imprint of their birth environments and the dynamical memory of the galaxies in which they formed (e.g. Kruijssen et al. 2019, 2020; Forbes 2020). Within the Λ cold dark matter (ΛCDM) paradigm, the Milky Way (MW) assembled hierarchically through a sequence of mergers and accretion events in which smaller systems were incorporated into progressively larger dark matter haloes (White & Rees 1978). The MW’s GC system preserves a fossil record of this process that is, in principle, legible through the kinematics, ages, and chemical abundances of individual clusters.
In the Gaia era (Gaia Collaboration 2018, 2023), integrals-of-motion analyses have established that the Galactic GC system is composite: roughly 40–45% of clusters were likely accreted from now-disrupted satellite galaxies, with the remainder formed in situ (Massari et al. 2019, 2023; Naidu et al. 2020, 2021; Youakim et al. 2023; Youakim & Lind 2025; Chen & Gnedin 2024). The major accreted components – Gaia–Enceladus–Sausage (GSE; Helmi et al. 2018; Belokurov et al. 2018), Sagittarius (Sgr; Ibata et al. 1994; Law & Majewski 2010; Ruiz-Lara et al. 2020), Sequoia (Seq; Barbá et al. 2019; Myeong et al. 2019), the Helmi streams (H99; Helmi et al. 1999; Koppelman et al. 2019), and proposed low-energy inner structures (Massari et al. 2019; Pfeffer et al. 2020; Horta et al. 2021; Malhan 2022; Massari et al. 2026) – together encode the hierarchical merger history of the Galaxy.
Kinematics alone, however, do not uniquely determine cluster origins. Dynamically heated in situ clusters can overlap with accreted debris in integrals-of-motion space, particularly at low orbital energies. The age–metallicity relation (AMR) provides an independent and physically motivated diagnostic: because galaxies of different masses enrich at different rates, their GC systems trace distinct loci in age–metallicity space (Brodie & Strader 2006; Leaman et al. 2013; Massari et al. 2019; Forbes 2020; Callingham et al. 2022). Combining kinematics with AMRs therefore offers a more robust basis for reconstructing the assembly history than either approach alone.
Realising this potential requires stellar population parameters that are both homogeneous and internally consistent. At old ages, systematic age uncertainties of a few hundred megayears are comparable to the temporal separation between early merger episodes (Wagner-Kaiser et al. 2017). A particularly important source of bias is helium: an enhanced helium abundance shifts the isochrone morphology in ways that can mimic younger ages if not modelled explicitly (Salaris & Cassisi 2005; Dotter et al. 2010; Valcarce et al. 2012). This matters because virtually all GCs host multiple stellar populations (MPs) – characterised by light-element abundance variations and, in many clusters, measurable helium spreads (Gratton et al. 2004, 2012, 2019; Bastian & Lardo 2018; Milone et al. 2018; Milone & Marino 2022) – and the MP fractions and helium enrichment vary systematically between clusters. AMR studies that ignore MPs therefore risk propagating helium-driven age biases into reconstructions of Galactic assembly (Milone et al. 2018; Cabrera-Ziri & Conroy 2022).
Whether MPs themselves carry information about the environment in which clusters formed is a separate and largely open question. MP properties – helium spreads, enriched population fractions, and light-element variation amplitudes – correlate strongly with cluster mass (Milone et al. 2017; Bastian & Lardo 2018), but it remains unclear whether they also depend on the host-galaxy environment. The most systematic prior test – comparing chromosome-map properties (Milone et al. 2017) across Magellanic Cloud and Galactic GCs – found no significant environmental dependence beyond the mass scaling, though that analysis employed a coarse in situ–accreted distinction without MP-aware stellar parameters (Milone et al. 2020). Whether finer progenitor resolution combined with helium-based indicators would reveal a residual environmental signal has not been tested. If indeed MPs correlate with environment, this would constitute an additional fossil record of galaxy assembly; if they do not, their formation is governed by universal cluster-scale physics independent of the large-scale galactic context. Distinguishing these scenarios requires a sample of clusters with homogeneous MP parameters spanning multiple progenitor systems – a dataset that had until now been unavailable.
Here we present a chemo-dynamical reconstruction of the MW GC system that addresses both issues simultaneously. We combined homogeneous stellar population parameters inferred while explicitly modelling MPs (Valcin et al. 2021, 2025, 2026) with a probabilistic dynamical classification of cluster progenitors, and used the resulting dataset to (i) reconstruct progenitor-specific AMRs within a hierarchical Bayesian framework and (ii) test whether MP properties – helium spreads (δY), mean helium abundances (![Mathematical equation: $\[\bar{Y}\]$](/articles/aa/full_html/2026/05/aa59820-26/aa59820-26-eq3.png) ), and first-population fractions (fP1) – follow universal scaling relations with cluster mass or retain a measurable imprint of the galactic environment in which clusters formed.
), and first-population fractions (fP1) – follow universal scaling relations with cluster mass or retain a measurable imprint of the galactic environment in which clusters formed.
All previous studies that tested for an environmental dependence of MP properties employed coarse in situ–accreted binary classifications (Milone et al. 2020), used pseudo-colour proxies sensitive to a combination of abundance variations rather than to helium specifically (Milone et al. 2017), or relied on stellar parameters derived under the single-population assumption and were therefore subject to systematic helium-driven age biases (Salaris & Cassisi 2005). No study has yet combined MP-aware stellar parameters, a multi-progenitor chemo-dynamical classification, and helium-specific indicators within a single homogeneous sample – a combination that is essential to disentangle the environmental from the cluster-mass signal.
The paper is organised as follows. Section 2 describes the data. Section 3 presents the chemo-dynamical clustering, hierarchical AMR modelling, and MP statistical framework. Section 4 reports the results, and Sect. 5 discusses the implications for MW assembly and the universality of MP formation.
2 Data
2.1 Stellar population parameters
Our sample comprises 69 Galactic GCs with high-quality Hubble Space Telescope (HST) multi-band photometry spanning a broad range in metallicity, mass, and dynamical properties. Cluster ages, [Fe/H], mean helium abundances (![Mathematical equation: $\[\bar{Y}\]$](/articles/aa/full_html/2026/05/aa59820-26/aa59820-26-eq4.png) ), helium spreads (δY), and first-population fractions (fP1) are adopted from Valcin et al. (2026). These are inferred via hierarchical Bayesian modelling of the full colour–magnitude diagram (CMD) morphology, explicitly accounting for two coexisting stellar populations sharing a common age and metallicity but differing in helium abundance and relative fraction. Helium is parametrised through
), helium spreads (δY), and first-population fractions (fP1) are adopted from Valcin et al. (2026). These are inferred via hierarchical Bayesian modelling of the full colour–magnitude diagram (CMD) morphology, explicitly accounting for two coexisting stellar populations sharing a common age and metallicity but differing in helium abundance and relative fraction. Helium is parametrised through ![Mathematical equation: $\[\bar{Y}\]$](/articles/aa/full_html/2026/05/aa59820-26/aa59820-26-eq5.png) and the inter-population difference (δY), a formulation that reduces the degeneracies arising when absolute helium abundances are sampled directly.
and the inter-population difference (δY), a formulation that reduces the degeneracies arising when absolute helium abundances are sampled directly.
Because age and helium are partially degenerate in CMD fitting, age posteriors are often non-Gaussian. Valcin et al. (2026) represent them as Gaussian mixture models, preserving asymmetric uncertainties and extended tails; these Gaussian mixture model representations are propagated directly into our hierarchical AMR modelling. Typical 68% credible uncertainties are ≈1.1 Gyr in age, ≈0.15 dex in [Fe/H], and ≈0.03 in ![Mathematical equation: $\[\bar{Y}\]$](/articles/aa/full_html/2026/05/aa59820-26/aa59820-26-eq6.png) , with modest cluster-to-cluster variation (0.9–1.7 Gyr, 0.14–0.17 dex, and 0.028–0.033, respectively), indicating uniform precision across the sample. Ages of the oldest components are statistically consistent with classical single-population determinations, confirming that explicitly modelling MPs improves internal consistency without shifting the absolute age scale. Extensive internal validation tests are presented in Valcin et al. (2026).
, with modest cluster-to-cluster variation (0.9–1.7 Gyr, 0.14–0.17 dex, and 0.028–0.033, respectively), indicating uniform precision across the sample. Ages of the oldest components are statistically consistent with classical single-population determinations, confirming that explicitly modelling MPs improves internal consistency without shifting the absolute age scale. Extensive internal validation tests are presented in Valcin et al. (2026).
2.2 Structural and dynamical parameters
The stellar population parameters described above are complemented by structural and orbital quantities, which serve as both as dynamical classification inputs and as control variables in the MP analysis.
Orbital parameters are computed with galpy (Bovy 2015) via a Monte Carlo (MC) framework (NMC = 500 realisations per cluster), using proper motions and covariances from Vasiliev & Baumgardt (2021). Heliocentric distances and line-of-sight velocities are sampled from Gaussians centred on their measured values; proper motions are drawn from a bivariate normal incorporating the published μα*–μδ covariance. Orbits are integrated backwards for 5 Gyr, sufficient to sample multiple orbital periods for all clusters and robustly estimate orbital extrema, in the MWPotential2014 potential (Bovy 2015), with the halo normalisation modestly increased relative to the default to bring the implied MW halo mass closer to recent literature estimates, augmented by a rotating Dehnen bar (Dehnen 2000) with fixed pattern speed Ωbar, ensuring that the Jacobi energy, EJ = E – ΩbarLz, is conserved in the rotating frame and constitutes a well-defined dynamical label for classification.
From each orbit we extracted the rperi, rapo, eccentricity (e), zmax, Lz, |L|, actions (Jr, Jz), the total specific energy (E), and the Jacobi energy (EJ). Actions were computed via the Stäckel approximation (Sanders & Binney 2015), which provides accurate estimates across a wide range of orbit types in realistic axisymmetric potentials; residual errors are largest for highly radial, resonant, or chaotic orbits, which represent a small minority of the present sample. All quantities are summarised by their 16th, 50th, and 84th MC percentiles.
Structural parameters – half-light radius (rh), core radius (rc), mass (M), tidal radius (rt), central density (ρc), and central velocity dispersion (σ) – are taken from the Baumgardt & Hilker (2018) catalogue, derived from dynamical modelling of HST and Gaia kinematics. Cluster mass is used as a control variable throughout the MP analysis, given its well-established influence on helium spreads (Milone et al. 2017).
3 Methods
The analysis proceeds in three connected stages. We first assigned each cluster a probabilistic progenitor family using chemo-dynamical clustering (Sect. 3.1), then reconstructed progenitor-specific enrichment histories within a hierarchical Bayesian framework (Sect. 3.2), and finally tested whether multiple-population properties depend on the inferred environment after controlling for cluster mass and metallicity (Sect. 3.3).
3.1 Chemo-dynamical clustering
We constructed a probabilistic classification of Galactic GCs using five features per cluster: the Jacobi energy in the rotating bar frame (EJ), the vertical angular momentum (Lz), the perpendicular angular momentum, ![Mathematical equation: $\[L_{\perp}=\sqrt{L_{x}^{2}+L_{y}^{2}}\]$](/articles/aa/full_html/2026/05/aa59820-26/aa59820-26-eq7.png) (a proxy for orbital inclination), the radial action (Jr), and the mean metallicity ([Fe/H]), all evaluated at their median MC values. These features span the energy, angular momentum, and radial action dimensions of orbital phase space; metallicity provides an independent chemical dimension that breaks the energy–Lz degeneracy between in situ and accreted clusters at low binding energy
(a proxy for orbital inclination), the radial action (Jr), and the mean metallicity ([Fe/H]), all evaluated at their median MC values. These features span the energy, angular momentum, and radial action dimensions of orbital phase space; metallicity provides an independent chemical dimension that breaks the energy–Lz degeneracy between in situ and accreted clusters at low binding energy
Six dynamical families were considered: GSE, Sgr, Seq, in situ, low-energy (lowE), and H99. For each family we fitted a multivariate Gaussian in standardised feature space using literature anchor clusters with robust prior associations (Massari et al. 2019, 2023; Youakim & Lind 2025). To mitigate over-fitting and allow physically motivated overlap between families, we applied strong covariance regularisation and softened class priors proportional to ![Mathematical equation: $\[\sqrt{N_{\text {anchor}}}\]$](/articles/aa/full_html/2026/05/aa59820-26/aa59820-26-eq8.png) .
.
Posterior membership probabilities were computed via Bayesian inference from the class likelihoods and priors. All clusters receive a family assignment to their highest-probability class; classification confidence is communicated through ‘secure’, ‘likely’, and ‘ambiguous’ tiers rather than a hard probability threshold (Appendix A). We verified that replacing hard assignments with probability-weighted regression leaves all MP results unchanged, as expected given that the majority of clusters have pmax ≥ 0.90.
3.2 Hierarchical modelling of the AMR
We modelled the AMRs within a hierarchical Bayesian framework that accounts for the small number of clusters per progenitor. Rather than fitting each progenitor independently, we adopted a partially pooled model in which enrichment parameters vary between progenitors but are regularised by a common population-level distribution, stabilising inference for sparsely sampled systems while permitting genuine inter-progenitor differences.
Each progenitor AMR is described by a truncated saturating exponential in look-back time (t),
=[\mathrm{Fe} / \mathrm{H}]_0+\Delta[\mathrm{Fe} / \mathrm{H}]\left(1-e^{-\left(L_0-t\right) / \tau}\right), L_{\text {stop }} \leq t \leq L_0,\]$](/articles/aa/full_html/2026/05/aa59820-26/aa59820-26-eq9.png)
where L0 is the onset look-back time, τ is the enrichment timescale controlling the curvature of the rise, Δ[Fe/H] is the total metallicity increase, and [Fe/H]stop ≡ [Fe/H]0 + Δ[Fe/H] is the terminal metallicity at which enrichment is truncated. For t < Lstop the metallicity is held fixed at [Fe/H]stop, encoding the cessation of star formation upon accretion into the MW potential. This parametrisation separates the pace of enrichment (τ, shared across progenitors to within population-level scatter) from its extent (Δ[Fe/H], which varies between systems), a distinction that proves central to the results of Sect. 4.3.
Asymmetric age uncertainties from the CMD analysis are propagated via latent true ages with split-normal likelihoods. Convergence was verified with the Gelman–Rubin diagnostic (![Mathematical equation: $\[\hat{R} \leq 1.003\]$](/articles/aa/full_html/2026/05/aa59820-26/aa59820-26-eq10.png) for all parameters) and confirmed by effective sample sizes exceeding 103, indicating that the indicating that the chains are well mixed and that posterior summaries – including credible intervals for τ, Δ[Fe/H], and [Fe/H]stop – are numerically stable.
for all parameters) and confirmed by effective sample sizes exceeding 103, indicating that the indicating that the chains are well mixed and that posterior summaries – including credible intervals for τ, Δ[Fe/H], and [Fe/H]stop – are numerically stable.
3.3 Statistical analysis of multiple-population indicators
To test whether MP properties depend on progenitor environment, we fitted linear models of the form
![Mathematical equation: $\[Y=\beta_0+\beta_1 ~\log~ M+\beta_2[\mathrm{Fe} / \mathrm{H}]+\epsilon\]$](/articles/aa/full_html/2026/05/aa59820-26/aa59820-26-eq11.png)
for each MP indicator Y ∈ {δY, fP1, ![Mathematical equation: $\[\bar{Y}\]$](/articles/aa/full_html/2026/05/aa59820-26/aa59820-26-eq12.png) }, with standardised predictors to facilitate comparison of effect sizes. Progenitor family is then added as a categorical variable, and its significance assessed via Type-III analysis of variance (ANOVA) with HC3 robust standard errors to account for heteroscedasticity1. The interaction terms
}, with standardised predictors to facilitate comparison of effect sizes. Progenitor family is then added as a categorical variable, and its significance assessed via Type-III analysis of variance (ANOVA) with HC3 robust standard errors to account for heteroscedasticity1. The interaction terms
![Mathematical equation: $\[Y \sim ~\log~ M+[\mathrm{Fe} / \mathrm{H}]+\operatorname{prog}+(\log~ M \times \operatorname{prog})+([\mathrm{Fe} / \mathrm{H}] \times \operatorname{prog})\]$](/articles/aa/full_html/2026/05/aa59820-26/aa59820-26-eq13.png)
test whether the mass–MP or metallicity–MP slopes themselves differ between progenitors; a null result implies universal scaling relations across in situ and accreted systems. Residual MP indicators, computed after subtracting the best-fitting mass and metallicity dependence, are used to visualise environmental offsets directly.
To assess the robustness of any detected progenitor signal, we repeated the regression after removing borderline Sequoia members individually and in combination, and performed a permutation test (n = 10 000 shuffles) to obtain an empirical null distribution for the progenitor F-statistic independent of parametric assumptions. We applied an analogous framework to test for dynamical evolution effects, examining correlations between MP indicators and orbital parameters (rperi, e, zmax, trh) and mass-loss proxies derived from initial cluster masses (Baumgardt & Hilker 2018).
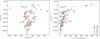 |
Fig. 1 Integrals-of-motion projections for the MW GC sample coloured by our final six-family probabilistic classification. Left: E–Lz plane. Right: E–L⊥. Colours and markers denote the assigned family (see the legend). We define the classification confidence using the maximum posterior probability (pmax) and the probability margin (Δp = pmax − p2nd) between the two most probable classes. Objects are considered secure when pmax ≥ 0.80 and Δp ≥ 0.20, likely when pmax ≥ 0.60 and Δp ≥ 0.10, and ambiguous otherwise. For clarity, cluster names are shown only for the objects with likely or ambiguous classifications (see Table A.1). |
4 Results
4.1 Dynamical families and chemical properties
Figure 1 shows the integrals-of-motion projections for the MW GC sample coloured by the six-family probabilistic classification (Sect. 3.1; Appendix A). The major accretion structures recover their expected dynamical signatures. Sagittarius occupies a compact, isolated locus in action–energy space, consistent with debris from a comparatively recent and not-yet fully phase-mixed accretion event (Ibata et al. 1994; Law & Majewski 2010; Ruiz-Lara et al. 2020). Sequoia clusters lie predominantly on retrograde orbits (negative Lz), consistent with their identification as the debris of a retrograde merger (Myeong et al. 2019; Barbá et al. 2019). The GSE family populates a broad distribution centred near Lz ≈ 0, as expected for the debris of a highly radial merger (Belokurov et al. 2018; Helmi et al. 2018). The Helmistream and low-energy families partially overlap with GSE in the central action–energy region, consistent with the strong phase mixing expected for early accretion debris in the inner halo (Helmi et al. 1999; Koppelman et al. 2019; Massari et al. 2019; Pfeffer et al. 2020; Horta et al. 2021; Massari et al. 2026).
The [Fe/H] distributions across the six families (Fig. 2, top) broadly follow the stellar mass–metallicity relation: the in situ population is the most metal-rich (⟨[Fe/H]⟩ = −0.77 ± 0.05 dex), while accreted systems span progressively lower metallicities ordered roughly by progenitor mass. H99 is the most metal-poor (−2.11 ± 0.09 dex), followed by Sequoia (−1.68 ± 0.11 dex), lowE (−1.72 ± 0.07 dex), GSE (−1.50 ± 0.06 dex), and Sagittarius (−1.46 ± 0.15 dex). An ANOVA test confirms that these differences are highly significant (p = 1.2 × 10⁻⁹), with the in situ population more metal-rich than GSE, Sequoia, and lowE at p < 10−3, and H99 significantly more metal-poor than both GSE (p ≃ 0.049) and Sagittarius (p ≃ 0.023).
Most accreted families show modest spreads (σint ≃ 0.16–0.34 dex), consistent with regulated pre-accretion enrichment. Sagittarius is the exception with σint = ![Mathematical equation: $\[0.53_{-0.17}^{+0.14}\]$](/articles/aa/full_html/2026/05/aa59820-26/aa59820-26-eq14.png) dex, suggestive of prolonged or multi-episode enrichment before and during disruption. The in situ family also shows elevated scatter (σint =
dex, suggestive of prolonged or multi-episode enrichment before and during disruption. The in situ family also shows elevated scatter (σint = ![Mathematical equation: $\[0.31_{-0.07}^{+0.06}\]$](/articles/aa/full_html/2026/05/aa59820-26/aa59820-26-eq15.png) dex), reflecting the heterogeneous formation histories of clusters born across the full MW potential.
dex), reflecting the heterogeneous formation histories of clusters born across the full MW potential.
In contrast to metallicity, [α/Fe] is remarkably homogeneous across families (Fig. 2, bottom), with medians spanning only ~0.20–0.31 dex. An analysis of covariance (ANCOVA) test shows that [α/Fe] is primarily driven by the [Fe/H] dependence (p = 1.4 × 10⁻⁴), with no significant residual family effect (p ≃ 0.066).
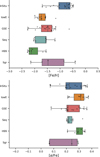 |
Fig. 2 Box-and-whisker plots showing the distributions of [Fe/H] (top) and [α/Fe] (bottom) for the GCs associated with each progenitor family. |
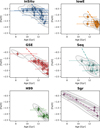 |
Fig. 3 AMRs for the final merged progenitor groups. Each panel shows individual GCs (points) with asymmetric age and metallicity uncertainties. Grey-shaded kernel-density contours highlight the main population distribution, and the orthogonal distance regression linear fit (dashed line) accounts for errors in both variables. The linear fits provide a visual diagnostic of the overall AMR trend within each progenitor; however, they should not be interpreted as physical enrichment rates, as the inferred slopes depend sensitively on the sampled age range. |
4.2 Age–metallicity relations
The AMRs of the final progenitor groups are shown in Fig. 3, with orthogonal distance regression linear fits overlaid to account for uncertainties in both age and metallicity. Before discussing individual systems, we stress that these slopes depend sensitively on the sampled age range and cluster numbers, and should be treated as descriptive diagnostics rather than physical enrichment rates; the hierarchical modelling in Sect. 4.3 provides the more physically motivated constraints.
With that caveat, several families show clear negative slopes indicating progressive enrichment. GSE has the best-defined relation (−0.50 ± 0.08 dex Gyr−1, 6.2σ), spanning a broad baseline in both age (~8.3–13.7 Gyr) and metallicity ([Fe/H] ≈ −2.27 to −0.64), consistent with an extended pre-accretion enrichment history. H99 shows a comparable slope (−0.46 ± 0.13 dex Gyr−1, 3.5σ) but over a narrower baseline (~12.0–13.8 Gyr; [Fe/H] ≈ −2.28 to −1.55). Sagittarius is shallower (−0.29 ± 0.05 dex Gyr−1, 5.7σ) yet covers the widest metallicity range ([Fe/H] ≈ −2.15 to −0.40) and a long age baseline (~7.5–13.4 Gyr), reflecting prolonged enrichment in a massive progenitor. The in situ population shows a significant slope (−0.62 ± 0.14 dex Gyr−1, 4.5σ) but the largest intrinsic dispersion (σint ≈ 0.47 dex), likely reflecting the heterogeneous formation histories of clusters born within the MW potential. The lowE group yields a marginal detection (−0.66 ± 0.33 dex Gyr−1, 2.0σ), while Sequoia’s slope is unconstrained (−0.85 ± 0.74 dex Gyr−1, 1.2σ).
The intrinsic metallicity dispersions are equally informative. H99 is remarkably chemically coherent (σint ≈ 0.08 dex), and Sagittarius, despite its wide metallicity span, shows only modest scatter (σint ≈ 0.13 dex). Both are consistent with regulated enrichment prior to or during disruption. GSE and lowE are intermediate (σint ≈ 0.3 dex), while the in situ population and Sequoia show the largest dispersions (σint ≳ 0.45 dex), reflecting heterogeneous origins in the former case and small-number statistics in the latter.
4.3 Hierarchical AMR constraints
Posterior constraints from the hierarchical AMR model (Sect. 3.2) are shown in Fig. 4 and summarised in Table 1.
Enrichment timescales. All progenitors yield enrichment timescales in the range τ ~ 1–2 Gyr, with the hierarchical population-level estimate μln τ = ![Mathematical equation: $\[0.69_{-0.38}^{+0.36}\]$](/articles/aa/full_html/2026/05/aa59820-26/aa59820-26-eq16.png) (corresponding to τ ≃2 Gyr). We caution, however, that this estimate carries a non-negligible prior contribution: when progenitor AMRs are fitted independently without pooling, group-level medians shift to τ ~ 1.1–1.4 Gyr with substantially wider credible intervals, and prior sensitivity tests show that ~40% of a shift in the hyper prior mean is transmitted to the posterior. The inter-group scatter σln τ is consistent with zero,confirming that the data cannot resolve differences in enrichment pace between systems at the present sample size. We therefore treated τ ≲2 Gyr as an order-of-magnitude constraint — while emphasising that the primary physically robust distinction between progenitors lies in the amplitude of chemical evolution Δ[Fe/H], which is genuinely data-driven and insensitive to the τ prior choice2. Initial metallicities are uniformly metal-poor across progenitors (μ[Fe/H]0 = −2.03 ± 0.12, group scatter ≈ 0.21 dex), and the inferred intrinsic scatter around the fitted relations is modest (σint,FeH ≈ 0.08 ± 0.05 dex), indicating that the truncated exponential captures the main AMR features without requiring substantial additional dispersion.
(corresponding to τ ≃2 Gyr). We caution, however, that this estimate carries a non-negligible prior contribution: when progenitor AMRs are fitted independently without pooling, group-level medians shift to τ ~ 1.1–1.4 Gyr with substantially wider credible intervals, and prior sensitivity tests show that ~40% of a shift in the hyper prior mean is transmitted to the posterior. The inter-group scatter σln τ is consistent with zero,confirming that the data cannot resolve differences in enrichment pace between systems at the present sample size. We therefore treated τ ≲2 Gyr as an order-of-magnitude constraint — while emphasising that the primary physically robust distinction between progenitors lies in the amplitude of chemical evolution Δ[Fe/H], which is genuinely data-driven and insensitive to the τ prior choice2. Initial metallicities are uniformly metal-poor across progenitors (μ[Fe/H]0 = −2.03 ± 0.12, group scatter ≈ 0.21 dex), and the inferred intrinsic scatter around the fitted relations is modest (σint,FeH ≈ 0.08 ± 0.05 dex), indicating that the truncated exponential captures the main AMR features without requiring substantial additional dispersion.
Enrichment amplitude and truncation. The main distinction between progenitors lies in the extent rather than the pace of chemical evolution. Most systems reach total metallicity growths of Δ[Fe/H] ~ 1.1–1.3 dex before truncation, with enrichment rates (Renrich = Δ[Fe/H]/τ) clustering around Renrich ≈ 0.50–0.63 dex Gyr−1 (GSE: ![Mathematical equation: $\[0.63_{-0.14}^{+0.21}\]$](/articles/aa/full_html/2026/05/aa59820-26/aa59820-26-eq17.png) ; H99:
; H99: ![Mathematical equation: $\[0.55_{-0.18}^{+0.26}\]$](/articles/aa/full_html/2026/05/aa59820-26/aa59820-26-eq18.png) ; Seq:
; Seq: ![Mathematical equation: $\[0.51_{-0.16}^{+0.23}\]$](/articles/aa/full_html/2026/05/aa59820-26/aa59820-26-eq19.png) ; lowE:
; lowE: ![Mathematical equation: $\[0.50_{-0.17}^{+0.24}\]$](/articles/aa/full_html/2026/05/aa59820-26/aa59820-26-eq20.png) ). Truncation look-back times cluster around Lstop ~ 7.4–7.5 Gyr for these four systems. Sagittarius is the outlier in all respects: it reaches Δ[Fe/H]med =
). Truncation look-back times cluster around Lstop ~ 7.4–7.5 Gyr for these four systems. Sagittarius is the outlier in all respects: it reaches Δ[Fe/H]med = ![Mathematical equation: $\[1.56_{-0.28}^{+0.33}\]$](/articles/aa/full_html/2026/05/aa59820-26/aa59820-26-eq21.png) dex and a terminal metallicity of [Fe/H]stop =
dex and a terminal metallicity of [Fe/H]stop = ![Mathematical equation: $\[-0.43_{-0.21}^{+0.29}\]$](/articles/aa/full_html/2026/05/aa59820-26/aa59820-26-eq22.png) , substantially higher than the other progenitors ([Fe/H]stop ≃ −1.0 to −0.8), with a correspondingly elevated Renrich =
, substantially higher than the other progenitors ([Fe/H]stop ≃ −1.0 to −0.8), with a correspondingly elevated Renrich = ![Mathematical equation: $\[0.79_{-0.21}^{+0.36}\]$](/articles/aa/full_html/2026/05/aa59820-26/aa59820-26-eq23.png) dex Gyr−1 and a somewhat later truncation (Lstop =
dex Gyr−1 and a somewhat later truncation (Lstop = ![Mathematical equation: $\[6.93_{-3.82}^{+2.01}\]$](/articles/aa/full_html/2026/05/aa59820-26/aa59820-26-eq24.png) Gyr). This is consistent with more efficient metal retention and prolonged star formation in a comparatively massive progenitor.
Gyr). This is consistent with more efficient metal retention and prolonged star formation in a comparatively massive progenitor.
Progenitor mass estimates. The AMR constraints can be combined with the GC census to estimate progenitor masses. Anchoring cluster counts to the full 154-object catalogue of Massari et al. (2019, 2023) and applying the empirical NGC–Mvir relation (Harris et al. 2017; Burkert & Forbes 2020; Reina-Campos et al. 2022), we infer halo masses of Mvir ~ (3–15) × 1010 M⊙. Translating AMR-inferred terminal metallicities into stellar masses via the dwarf-galaxy mass–metallicity relation (Kirby et al. 2013) yields M⋆ ~ 109 M⊙ for GSE and the low-energy group, lower values for Sequoia and the Helmi progenitor, and a substantially higher value for Sagittarius. The chemistry-only estimate for Sagittarius, however, exceeds the dynamical constraint of M⋆ ~ (2–3) × 108 M⊙ from Pfeffer et al. (2020), likely because the high terminal metallicity of its GC system does not straight-forwardly trace the global field-star mass–metallicity relation in a system with prolonged and complex chemical evolution. Incorporating the Pfeffer et al. (2020) dynamical constraints as priors shifts Sagittarius into the expected mass range while leaving the GC-number-based halo masses essentially unchanged (Fig. 5), and identifies GSE and the low-energy progenitor as the dominant accretion events.
 |
Fig. 4 Hierarchical Bayesian AMRs for accreted MW progenitors traced by GCs. Left: absolute look-back age versus [Fe/H], with observational uncertainties shown as error bars. Solid lines indicate the posterior median AMR for each progenitor, and shaded regions represent the 68% (dark) and 90% (light) credible intervals derived from posterior samples. Right: same relations expressed in relative time since enrichment onset, Δt = L0 − t, highlighting the inferred enrichment duration prior to truncation. |
Posterior constraints on the AMR parameters for each accreted progenitor family.
4.4 MPs and environment
Having established the large-scale enrichment histories of the progenitor systems, we turned to their internal stellar populations, asking whether the helium-based MP indicators that were held fixed in the AMR modelling carry any residual imprint of the galactic environment in which each cluster formed. In particular, using the regression framework described in Sect. 3.3, we investigated whether MP properties depend on progenitor environment after controlling for cluster mass and metallicity.
Cluster mass is the dominant predictor across all three indicators. The helium spread δY increases with mass (p ≈ 10−5), the first-population fraction fP1 decreases (p ≈ 3 × 10⁻⁵), and the mean helium abundance ![Mathematical equation: $\[\bar{Y}\]$](/articles/aa/full_html/2026/05/aa59820-26/aa59820-26-eq55.png) shows a weaker but significant positive dependence (p ≈ 0.02). Metallicity does not contribute significantly once mass is included (p > 0.1). These mass scalings are consistent across both in situ and accreted systems: interaction tests find no evidence that the slope of the mass–MP relation differs between progenitors, indicating that this relation is universal.
shows a weaker but significant positive dependence (p ≈ 0.02). Metallicity does not contribute significantly once mass is included (p > 0.1). These mass scalings are consistent across both in situ and accreted systems: interaction tests find no evidence that the slope of the mass–MP relation differs between progenitors, indicating that this relation is universal.
After removing the mass and metallicity dependence, we compared the residual MP properties across progenitor families (Fig. 6). We emphasise that the quantities plotted in Fig. 6 are residuals of δY, fP1, and ![Mathematical equation: $\[\bar{Y}\]$](/articles/aa/full_html/2026/05/aa59820-26/aa59820-26-eq56.png) after the mass and metallicity dependences have been removed, rather than the physical MP properties themselves. By construction, the observed helium spread satisfies δY ≥ 0, since it measures the enhancement of the second population relative to the primordial one. The residual δY shown here, however, represents the deviation of a given cluster from the mean mass–metallicity trend and can therefore take either sign: a negative residual simply indicates a cluster whose helium spread is smaller than predicted by the global δY(M⋆, [Fe/H]) relation, not a physically negative helium enhancement. The same interpretation applies to the fP1 and
after the mass and metallicity dependences have been removed, rather than the physical MP properties themselves. By construction, the observed helium spread satisfies δY ≥ 0, since it measures the enhancement of the second population relative to the primordial one. The residual δY shown here, however, represents the deviation of a given cluster from the mean mass–metallicity trend and can therefore take either sign: a negative residual simply indicates a cluster whose helium spread is smaller than predicted by the global δY(M⋆, [Fe/H]) relation, not a physically negative helium enhancement. The same interpretation applies to the fP1 and ![Mathematical equation: $\[\bar{Y}\]$](/articles/aa/full_html/2026/05/aa59820-26/aa59820-26-eq57.png) panels.
panels.
The mean helium abundance (![Mathematical equation: $\[\bar{Y}\]$](/articles/aa/full_html/2026/05/aa59820-26/aa59820-26-eq58.png) ) shows no significant progenitor dependence. The helium spread δY shows a nominally significant progenitor term (p ≈ 0.03), driven by slightly smaller spreads in Sequoia clusters, but this signal does not survive removal of the two most uncertain Sequoia members (Palomar 15 and Pyxis, which carry ambiguous or conflicting literature classifications; see Table A.1): dropping either cluster individually pushes p > 0.08, and removing both yields p = 0.26 We therefore treat the δY–Sequoia trend as suggestive but unconfirmed.
) shows no significant progenitor dependence. The helium spread δY shows a nominally significant progenitor term (p ≈ 0.03), driven by slightly smaller spreads in Sequoia clusters, but this signal does not survive removal of the two most uncertain Sequoia members (Palomar 15 and Pyxis, which carry ambiguous or conflicting literature classifications; see Table A.1): dropping either cluster individually pushes p > 0.08, and removing both yields p = 0.26 We therefore treat the δY–Sequoia trend as suggestive but unconfirmed.
In contrast, the fP1–Sequoia signal is robust. Sequoia clusters show systematically higher fP1 at fixed mass and metallicity (p ≈ 8.6 × 10⁻⁴; Fig. 7), corresponding to smaller enriched stellar fractions. This result strengthens when Palomar 15 is removed (p ≈ 3.9 × 10⁻⁴) and remains significant across all reclassification subsets, including after dropping both borderline members (p ≈ 1.4 × 10⁻³, NSeq = 5). The direction and magnitude of the Sequoia coefficient are stable throughout, indicating that the signal is a property of the group rather than an artefact of uncertain classification. Among the accreted families, GSE and H99 clusters tend towards lower fP1 at fixed mass and metallicity, suggesting that the relative proportions of enriched and non-enriched stars retain a weak but real imprint of the formation environment.
As an independent check, we modelled chromosome-map pseudo-colour widths (Milone et al. 2017) for the 56 clusters with available measurements. Both WC F275W,F336W,F438W and WmF275W–mF814W are strongly predicted by cluster mass and metallicity (p ≲ 10−7), while progenitor origin and cluster age contribute no additional explanatory power once these are included. This confirms that the mass–MP scaling is universal and environmentally blind, consistent with the helium-based results above.
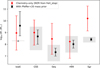 |
Fig. 5 Progenitor stellar masses inferred from the AMR subsample compared to dynamical constraints. Grey-shaded boxes indicate the allowed progenitor stellar-mass ranges inferred from GC orbital information in E-MOSAICS by Pfeffer et al. (2020). Black points show the chemistry-only M⋆ posteriors obtained by inverting the dwarf mass–metallicity relation using the AMR-inferred [Fe/H]stop (error bars are the 16th–84th percentiles from MC propagation). Red points show the corresponding importance-weighted posteriors after applying the Pfeffer et al. (2020) mass constraints as a prior in log M⋆. |
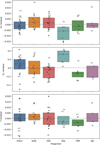 |
Fig. 6 Residuals of the multiple-population properties δY (top), fP1 (middle), and |
![Mathematical equation: $\[\bar{Y}\]$](/articles/aa/full_html/2026/05/aa59820-26/aa59820-26-eq59.png)
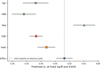 |
Fig. 7 Predicted values of the linear model evaluated at a common reference point (log Mz = 0, [Fe/H]z = 0) for each progenitor family. Points represent the estimated marginal means, and horizontal bars indicate the 68% confidence intervals derived from the fitted model. After controlling for cluster mass and metallicity, the fraction of first-population stars (fP1) shows systematic differences between progenitors, with Sequoia clusters exhibiting higher fP1 values at fixed mass and metallicity. |
4.5 Dynamical evolution tests
Before interpreting the progenitor dependence of fP1 as a formation signal, we assessed whether any of the detected MP trends could instead reflect long-term dynamical erosion of MPs over the clusters’ orbital histories. In particular, we tested whether MP tracers are modified by long-term dynamical evolution, examining correlations with present-day orbital parameters, mass-loss proxies, and eccentricity-binned population fractions.
Spearman rank tests against orbital quantities reveal only weak trends. The strongest involve pericentric distance, where δY and ![Mathematical equation: $\[\bar{Y}\]$](/articles/aa/full_html/2026/05/aa59820-26/aa59820-26-eq60.png) show mild anti-correlations (p = 0.024 and p = 0.029), but neither survives false-discovery-rate correction (pFDR ≈ 0.06). All other orbital quantities yield |ρ| ≲ 0.21 with no significant residuals after false-discovery-rate correction.
show mild anti-correlations (p = 0.024 and p = 0.029), but neither survives false-discovery-rate correction (pFDR ≈ 0.06). All other orbital quantities yield |ρ| ≲ 0.21 with no significant residuals after false-discovery-rate correction.
Mass-loss proxies derived from initial mass estimates (Baumgardt & Hilker 2018) – the logarithmic parameter Δ log M = log10 (Minit/Mnow) and fractional mass loss floss – show apparently significant correlations with all three MP indicators (raw Spearman p ≤ 0.015). However, because current and initial cluster masses are strongly correlated, these signals disappear entirely once present-day cluster mass and metallicity are included as covariates: the mass-loss term is non-significant for all indicators (p = 0.22, 0.35, and 0.91 for δY, fP1, and ![Mathematical equation: $\[\bar{Y}\]$](/articles/aa/full_html/2026/05/aa59820-26/aa59820-26-eq61.png) , respectively), confirming that the apparent signal is a secondary reflection of the mass–MP relation rather than evidence of dynamical erosion.
, respectively), confirming that the apparent signal is a secondary reflection of the mass–MP relation rather than evidence of dynamical erosion.
Two further null results reinforce this conclusion. Dividing clusters within each progenitor into high- and low-eccentricity bins yields no significant difference in median fP1 for any group with sufficient members (in situ: p = 0.40; GSE: p = 0.42; lowE: p = 0.63), arguing against preferential erosion of firstpopulation stars on radial orbits. Similarly, present-day cluster mass distributions do not differ significantly between progenitor groups (all pairwise Kolmogorov–Smirnov tests yield pFDR ≳ 0.33), providing no evidence that tidal destruction has systematically biased the surviving cluster population of any particular progenitor.
5 Discussion and conclusions
5.1 Chemical evolution of the MW progenitors
The metallicity distributions of the six dynamical families broadly follow the galaxy stellar mass–metallicity relation (Kirby et al. 2013; Kruijssen et al. 2019; Massari et al. 2019; Forbes 2020): lower-mass progenitors produce more metal-poor GC systems, while the in situ population is the most enriched. Helmi-like clusters occupy the most metal-poor regime; GSE, Sequoia, and lowE sit at intermediate metallicities; and Sagittarius spans the widest range with the largest intrinsic dispersion (Bellazzini et al. 2006; Siegel et al. 2007), consistent with more efficient metal retention and sustained star formation in a comparatively massive progenitor (Hasselquist et al. 2017; Ruiz-Lara et al. 2020).
Despite these [Fe/H] differences, [α/Fe] ratios are largely homogeneous across families once the metallicity dependence is removed, with no significant residual offsets between progenitors. This indicates that virtually all clusters in the sample formed during the early α-enhanced phase of chemical evolution, before substantial Type Ia supernova enrichment, and that the star-formation histories of these progenitors were broadly comparable in their early phases despite their different masses and accretion epochs (Venn et al. 2004; Matteucci 2012).
5.2 Age–metallicity relations and enrichment histories
The hierarchical AMR modelling places enrichment timescales broadly in the range τ ≲2 Gyr across all progenitors. This convergence is physically plausible – it is consistent with gas-consumption timescales in early star-forming dwarf galaxies (Matteucci & Recchi 2001; Lanfranchi & Matteucci 2003) – but we caution that it is not purely data-driven. We therefore treat τ ≲ 2 Gyr as an order-of-magnitude upper constraint and caution against over-interpreting the precise value.
The main distinction between systems lies in the extent of their chemical evolution: most reach Δ[Fe/H] ~ 1.1–1.3 dex before truncation, while Sagittarius achieves Δ[Fe/H] ≃ 1.6 dex and substantially higher terminal metallicities, consistent with more efficient metal retention and sustained star formation in a more massive progenitor (Hasselquist et al. 2017). These differences are consistent with the galaxy stellar mass–metallicity relation (Kirby et al. 2013), and imply that the progenitors contributing to the MW halo spanned stellar masses of roughly 107–109 M⊙, consistent with expectations from cosmological simulations of galaxy assembly.
Truncation epochs cluster around look-back times of ~7–8 Gyr for most systems, in broad agreement with the accretion epochs inferred from dynamical studies and cosmological simulations (Belokurov et al. 2018; Helmi et al. 2018; Pfeffer et al. 2020; Massari et al. 2026). Satellite galaxies lose their gas and cease star formation shortly after accretion into a larger halo through tidal stripping and ram-pressure processes, so this coincidence between chemical truncation and dynamically inferred accretion epochs provides an independent confirmation of the hierarchical assembly scenario.
Terminal metallicities inferred from the AMR provide an approximate progenitor mass ranking, though the ordering depends on whether purely chemical or dynamical scalings are applied. Chemistry alone overestimates the Sagittarius mass because its GC system reaches anomalously high metallicities relative to its true stellar mass – a tension that is physically informative. The high terminal metallicity of the Sagittarius GC system likely reflects a combination of localised enrichment in the dense central regions of the progenitor and the fact that GCs preferentially sample the metal-rich tail of the field-star metallicity distribution in a system with complex, multi-episode star formation (Ruiz-Lara et al. 2020; Hasselquist et al. 2017). This makes the dwarf-galaxy mass–metallicity relation (Kirby et al. 2013) a poor mass estimator for Sagittarius specifically, and serves as a caution against applying chemical scalings uniformly across progenitors with very different star-formation histories. Incorporating the E-MOSAICS dynamical constraints (Pfeffer et al. 2018, 2020) resolves this tension and identifies GSE and the low-energy progenitor as the dominant events (Aguado-Agelet et al. 2025; Massari et al. 2026). This is consistent with a Λ CDM assembly history featuring two major mergers – a deep early event at z ≳ 2 and a later GSE-like accretion at z ~ 1–2 – superimposed on numerous minor accretions (Kruijssen et al. 2019).
5.3 Universality of cluster-scale physics
In contrast to the clear environmental signatures in GC ages and metallicities, MP properties are largely insensitive to progenitor origin. After controlling for cluster mass and metallicity, neither δY nor ![Mathematical equation: $\[\bar{Y}\]$](/articles/aa/full_html/2026/05/aa59820-26/aa59820-26-eq62.png) shows a significant dependence on dynamical family, and the mass–MP scaling relation is statistically indistinguishable across in situ and accreted systems. These findings are confirmed by independent chromosome-map pseudo-colour widths, which show no progenitor dependence once mass and metallicity are included (Milone et al. 2017, 2020; Bastian & Lardo 2018).
shows a significant dependence on dynamical family, and the mass–MP scaling relation is statistically indistinguishable across in situ and accreted systems. These findings are confirmed by independent chromosome-map pseudo-colour widths, which show no progenitor dependence once mass and metallicity are included (Milone et al. 2017, 2020; Bastian & Lardo 2018).
The mass scalings of δY and fP1 are qualitatively consistent with the inertial-inflow model of Gieles et al. (2025), in which a supermassive star forming via stellar collisions at the cluster centre pollutes the intracluster medium through its winds, with the mass fraction of chemically processed stars scaling with cluster potential depth. That model also predicts a dependence of the anomalous-star fraction on metallicity; our data do not independently confirm this, likely because mass and metallicity are correlated in our sample and mass absorbs the combined signal. The high-redshift environment in which most GCs formed – characterised by denser, more pressurised interstellar media and higher star formation efficiencies (Trenti et al. 2015; Kruijssen 2012; Kruijssen et al. 2019; Pfeffer et al. 2020) – provides a natural setting for this behaviour, with differences between host galaxies manifesting primarily in their chemical enrichment histories and merger timescales rather than in the internal abundance patterns of individual clusters.
Sequoia clusters show systematically higher first-population fractions at fixed mass and metallicity, and this signal is robust to the removal of borderline members (Sect. 4.4). The robustness of this result across both our probabilistic classification and the independent assignments of Massari et al. (2019, 2023) confirms that it reflects a genuine physical property of the Sequoia progenitor rather than an artefact of any particular classification methodology. This residual environmental dependence has no counterpart in the Gieles et al. (2025) framework, which operates purely at cluster scales, and may reflect a secondary modulation of the enrichment balance by large-scale conditions in the Sequoia progenitor that their model does not yet capture. Among the accreted families, GSE and H99 clusters tend towards lower fP1 at fixed mass and metallicity, further supporting the interpretation that the relative proportions of enriched and non-enriched stars retain a weak but real imprint of the formation environment, even while the overall amplitude of helium enrichment does not.
We interpret the dominant mass dependence as evidence that the physical conditions required to produce light-element abundance variations were widespread across galaxies in the early Universe and regulated primarily by the cluster gravitational potential, operating in a largely universal manner regardless of host galaxy. The sole robust exception – a residual progenitor dependence in fP1 – suggests that at least one aspect of the enrichment balance is sensitive to the large-scale environment (Martocchia et al. 2018; Milone et al. 2020), pointing towards a secondary role for host-galaxy conditions that future models will need to accommodate.
5.4 Dynamical evolution and robustness of MP signatures
The environmental blindness of helium enrichment amplitude would be undermined if tidal evolution systematically modified MP signatures over a Hubble time; we therefore verified that the mass-scaling results are not a secondary consequence of preferential mass loss in particular progenitor systems. Correlations between MP tracers and orbital parameters are weak and statistically insignificant after correction for multiple testing. Mass-loss proxies show apparent correlations with MP indicators, but these vanish once cluster mass is included in the models, confirming that the signal is a secondary reflection of the mass–MP relation rather than evidence of dynamical erosion (Baumgardt & Hilker 2018). Helium-related MP signatures therefore appear to be set at formation and largely preserved over ~10 Gyr of dynamical evolution, consistent with the observational conclusion of Bastian & Lardo (2015) that tidal mass loss does not drive the present-day distribution of enriched-star fractions across the Galactic GC population.
5.5 Implications for GC formation and Galactic assembly
The Galactic GC system encodes two largely distinct layers of information. Ages, metallicities, and orbital properties trace the hierarchical assembly and chemical enrichment of their progenitor galaxies: different systems experienced similar enrichment timescales but different extents of chemical evolution, and the AMRs provide indirect constraints on progenitor masses and merger epochs that are broadly consistent with the ΛCDM picture of MW assembly. Satellite galaxies lose their gas and cease star formation shortly after accretion into a larger halo due to tidal stripping and ram-pressure processes, so the coincidence between the chemical truncation epochs inferred from the AMRs and the dynamically inferred accretion times provides an independent confirmation of the hierarchical assembly scenario. In contrast, the internal complexity of MPs is primarily governed by cluster mass and is largely insensitive to galactic environment, with the sole robust exception being the residual progenitor dependence in fP1. This duality – environmental memory in the ages and metallicities, near-universal cluster-scale physics in the stellar populations – highlights the complementary power of chemo-dynamical classification and homogeneous MP modelling as probes of both galaxy assembly and star cluster formation.
A key methodological novelty of this work is the explicit treatment of MPs in the stellar parameter inference (Valcin et al. 2026): by modelling two coexisting populations in each CMD, we avoided the systematic helium-driven age biases that affect single-population analyses (Salaris & Cassisi 2005) and obtained helium-specific MP indicators – δY, ![Mathematical equation: $\[\bar{Y}\]$](/articles/aa/full_html/2026/05/aa59820-26/aa59820-26-eq63.png) , and fP1 – that can be directly compared to theoretical predictions. This combination of MP-aware ages and multi-progenitor classification, applied to a homogeneous 69-cluster sample, represents the first test of whether helium enrichment properties carry an environmental imprint across the full hierarchy of MW accretion events. As future surveys extend precise age and abundance measurements to larger samples of clusters in nearby galaxies, this combination of approaches may become an increasingly powerful tool for reconstructing merger histories beyond the MW.
, and fP1 – that can be directly compared to theoretical predictions. This combination of MP-aware ages and multi-progenitor classification, applied to a homogeneous 69-cluster sample, represents the first test of whether helium enrichment properties carry an environmental imprint across the full hierarchy of MW accretion events. As future surveys extend precise age and abundance measurements to larger samples of clusters in nearby galaxies, this combination of approaches may become an increasingly powerful tool for reconstructing merger histories beyond the MW.
Acknowledgements
This work has made use of data from the European Space Agency (ESA) mission Gaia3, processed by the Gaia Data Processing and Analysis Consortium (DPAC). Funding for the DPAC has been provided by national institutions, in particular the institutions participating in the Gaia Multilateral Agreement. This research has made use of the SIMBAD database, operated at CDS, Strasbourg, France, and NASA’s Astrophysics Data System. All computations were performed in Python 3.12 using the scientific Python ecosystem, including NumPy, SciPy, pandas, scikit-learn, statsmodels, matplotlib, and seaborn. Orbit integrations and dynamical quantities were computed with galpy (Bovy 2015). Statistical analyses and probabilistic modelling were implemented using standard scientific Python tools.
References
- Aguado-Agelet, F., Massari, D., Monelli, M., et al. 2025, A&A, 704, A255 [NASA ADS] [CrossRef] [EDP Sciences] [Google Scholar]
- Barbá, R. H., Minniti, D., Geisler, D., et al. 2019, ApJ, 870, L24 [CrossRef] [Google Scholar]
- Bastian, N., & Lardo, C. 2015, MNRAS, 453, 357 [NASA ADS] [CrossRef] [Google Scholar]
- Bastian, N., & Lardo, C. 2018, ARA&A, 56, 83 [Google Scholar]
- Baumgardt, H., & Hilker, M. 2018, MNRAS, 478, 1520 [Google Scholar]
- Bellazzini, M., Newberg, H. J., Correnti, M., Ferraro, F. R., & Monaco, L. 2006, A&A, 457, L21 [NASA ADS] [CrossRef] [EDP Sciences] [Google Scholar]
- Belokurov, V., Erkal, D., Evans, N. W., Koposov, S. E., & Deason, A. J. 2018, MNRAS, 478, 611 [Google Scholar]
- Bovy, J. 2015, ApJS, 216, 29 [NASA ADS] [CrossRef] [Google Scholar]
- Brodie, J. P., & Strader, J. 2006, ARA&A, 44, 193 [Google Scholar]
- Burkert, A., & Forbes, D. A. 2020, AJ, 159, 56 [Google Scholar]
- Cabrera-Ziri, I., & Conroy, C. 2022, MNRAS, 511, 341 [NASA ADS] [CrossRef] [Google Scholar]
- Callingham, T. M., Cautun, M., Deason, A. J., et al. 2022, MNRAS, 513, 4107 [NASA ADS] [CrossRef] [Google Scholar]
- Chen, Y., & Gnedin, O. Y. 2024, Open J. Astrophys., 7, 23 [NASA ADS] [Google Scholar]
- Dehnen, W. 2000, AJ, 119, 800 [NASA ADS] [CrossRef] [Google Scholar]
- Dotter, A., Sarajedini, A., Anderson, J., et al. 2010, ApJ, 708, 698 [Google Scholar]
- Forbes, D. A. 2020, MNRAS, 493, 847 [Google Scholar]
- Gaia Collaboration (Brown, A. G. A., et al.) 2018, A&A, 616, A1 [NASA ADS] [CrossRef] [EDP Sciences] [Google Scholar]
- Gaia Collaboration (Vallenari, A., et al.) 2023, A&A, 674, A1 [NASA ADS] [CrossRef] [EDP Sciences] [Google Scholar]
- Gieles, M., Padoan, P., Charbonnel, C., Vink, J. S., & Ramírez-Galeano, L. 2025, MNRAS, 544, 483 [Google Scholar]
- Gratton, R., Sneden, C., & Carretta, E. 2004, ARA&A, 42, 385 [Google Scholar]
- Gratton, R. G., Carretta, E., & Bragaglia, A. 2012, A&A Rev., 20, 50 [Google Scholar]
- Gratton, R., Bragaglia, A., Carretta, E., et al. 2019, A&A Rev., 27, 8 [Google Scholar]
- Harris, W. E., Blakeslee, J. P., & Harris, G. L. H. 2017, ApJ, 836, 67 [Google Scholar]
- Hasselquist, S., Shetrone, M., Smith, V., et al. 2017, ApJ, 845, 162 [Google Scholar]
- Helmi, A., White, S. D. M., de Zeeuw, P. T., & Zhao, H. 1999, Nature, 402, 53 [Google Scholar]
- Helmi, A., Babusiaux, C., Koppelman, H. H., et al. 2018, Nature, 563, 85 [Google Scholar]
- Horta, D., Schiavon, R. P., Mackereth, J. T., et al. 2021, MNRAS, 500, 1385 [Google Scholar]
- Ibata, R. A., Gilmore, G., & Irwin, M. J. 1994, Nature, 370, 194 [Google Scholar]
- Kirby, E. N., Cohen, J. G., Guhathakurta, P., et al. 2013, ApJ, 779, 102 [Google Scholar]
- Koppelman, H. H., Helmi, A., Massari, D., Roelenga, S., & Bastian, U. 2019, A&A, 625, A5 [NASA ADS] [CrossRef] [EDP Sciences] [Google Scholar]
- Kruijssen, J. M. D. 2012, MNRAS, 426, 3008 [Google Scholar]
- Kruijssen, J. M. D., Pfeffer, J. L., Reina-Campos, M., Crain, R. A., & Bastian, N. 2019, MNRAS, 486, 3180 [Google Scholar]
- Kruijssen, J. M. D., Pfeffer, J. L., Chevance, M., et al. 2020, MNRAS, 498, 2472 [NASA ADS] [CrossRef] [Google Scholar]
- Lanfranchi, G. A., & Matteucci, F. 2003, MNRAS, 345, 71 [Google Scholar]
- Law, D. R., & Majewski, S. R. 2010, ApJ, 718, 1128 [Google Scholar]
- Leaman, R., VandenBerg, D. A., & Mendel, J. T. 2013, MNRAS, 436, 122 [Google Scholar]
- Malhan, K. 2022, ApJ, 930, L9 [NASA ADS] [CrossRef] [Google Scholar]
- Martocchia, S., Cabrera-Ziri, I., Lardo, C., et al. 2018, MNRAS, 473, 2688 [NASA ADS] [CrossRef] [Google Scholar]
- Massari, D., Koppelman, H. H., & Helmi, A. 2019, A&A, 630, L4 [NASA ADS] [CrossRef] [EDP Sciences] [Google Scholar]
- Massari, D., Aguado-Agelet, F., Monelli, M., et al. 2023, A&A, 680, A20 [NASA ADS] [CrossRef] [EDP Sciences] [Google Scholar]
- Massari, D., Zerbinati, C., Fanelli, C., et al. 2026, Nature, submitted, [arXiv:2601.18896] [Google Scholar]
- Matteucci, F. 2012, Chemical Evolution of Galaxies, Astronomy and Astrophysics Library (Berlin Heidelberg: Springer) [Google Scholar]
- Matteucci, F., & Recchi, S. 2001, ApJ, 558, 351 [NASA ADS] [CrossRef] [Google Scholar]
- Milone, A. P., & Marino, A. F. 2022, Universe, 8, 359 [NASA ADS] [CrossRef] [Google Scholar]
- Milone, A. P., Piotto, G., Renzini, A., et al. 2017, MNRAS, 464, 3636 [Google Scholar]
- Milone, A. P., Marino, A. F., Renzini, A., et al. 2018, MNRAS, 481, 5098 [NASA ADS] [CrossRef] [Google Scholar]
- Milone, A. P., Marino, A. F., Da Costa, G. S., et al. 2020, MNRAS, 491, 515 [NASA ADS] [CrossRef] [Google Scholar]
- Myeong, G. C., Vasiliev, E., Iorio, G., Evans, N. W., & Belokurov, V. 2019, MNRAS, 488, 1235 [Google Scholar]
- Naidu, R. P., Conroy, C., Bonaca, A., et al. 2020, ApJ, 901, 48 [Google Scholar]
- Naidu, R. P., Conroy, C., Bonaca, A., et al. 2021, ApJ, 923, 92 [NASA ADS] [CrossRef] [Google Scholar]
- Padoan, P., Jimenez, R., & Jones, B. 1997, MNRAS, 285, 711 [Google Scholar]
- Pfeffer, J., Kruijssen, J. M. D., Crain, R. A., & Bastian, N. 2018, MNRAS, 475, 4309 [Google Scholar]
- Pfeffer, J. L., Trujillo-Gomez, S., Kruijssen, J. M. D., et al. 2020, MNRAS, 499, 4863 [CrossRef] [Google Scholar]
- Reina-Campos, M., Keller, B. W., Kruijssen, J. M. D., et al. 2022, MNRAS, 517, 3144 [NASA ADS] [CrossRef] [Google Scholar]
- Ruiz-Lara, T., Gallart, C., Bernard, E. J., & Cassisi, S. 2020, Nat. Astron., 4, 965 [NASA ADS] [CrossRef] [Google Scholar]
- Salaris, M., & Cassisi, S. 2005, Evolution of Stars and Stellar Populations (Hoboken: Wiley-VCH) [Google Scholar]
- Sanders, J. L., & Binney, J. 2015, MNRAS, 447, 2479 [CrossRef] [Google Scholar]
- Siegel, M. H., Dotter, A., Majewski, S. R., et al. 2007, ApJ, 667, L57 [NASA ADS] [CrossRef] [Google Scholar]
- Trenti, M., Padoan, P., & Jimenez, R. 2015, ApJ, 808, L35 [NASA ADS] [CrossRef] [Google Scholar]
- Valcarce, A. A. R., Catelan, M., & Sweigart, A. V. 2012, A&A, 547, A5 [NASA ADS] [CrossRef] [EDP Sciences] [Google Scholar]
- Valcin, D., Jimenez, R., Verde, L., Bernal, J. L., & Wandelt, B. D. 2021, J. Cosmology Astropart. Phys., 2021, 017 [Google Scholar]
- Valcin, D., Jimenez, R., Seljak, U., & Verde, L. 2025, J. Cosmology Astropart. Phys., 2025, 030 [Google Scholar]
- Valcin, D., Jimenez, R., Lardo, C., Seljak, U., & Verde, L. 2026, JCAP, submitted, [arXiv:2603.04872] [Google Scholar]
- Vasiliev, E., & Baumgardt, H. 2021, MNRAS, 505, 5978 [NASA ADS] [CrossRef] [Google Scholar]
- Venn, K. A., Irwin, M., Shetrone, M. D., et al. 2004, AJ, 128, 1177 [NASA ADS] [CrossRef] [Google Scholar]
- Wagner-Kaiser, R., Sarajedini, A., von Hippel, T., et al. 2017, MNRAS, 468, 1038 [NASA ADS] [CrossRef] [Google Scholar]
- White, S. D. M., & Rees, M. J. 1978, MNRAS, 183, 341 [Google Scholar]
- Youakim, K., & Lind, K. 2025, A&A, 704, A296 [NASA ADS] [CrossRef] [EDP Sciences] [Google Scholar]
- Youakim, K., Lind, K., & Kushniruk, I. 2023, MNRAS, 524, 2630 [Google Scholar]
We verified that replacing hard family assignments with probability-weighted regression – where each cluster contributes to each family in proportion to its posterior membership probability – leaves all results unchanged. This is expected given that the majority of clusters have pmax ≥ 0.90 (Table A.1), so the two approaches are numerically near-identical for the present sample.
As an additional check, we fixed τ to a grid of values spanning 0.5–4 Gyr and verified that the posteriors of Δ[Fe/H] and [Fe/H]stop vary by less than 0.1 dex, while Lstop changes by less than 0.3 Gyr. This confirms that the inferred quantities are insensitive to the precise value of τ within its credible range.
Available at https://www.oas.inaf.it/it/ricerca/m2-it/carma-it/
Appendix A Assessment of probabilistic cluster classifications
Table A.1 presents the full probabilistic classification. Each cluster is assigned to the family with the highest posterior probability pmax, graded into secure (pmax ≥ 0.80, Δp ≥ 0.20), likely (pmax ≥ 0.60, Δp ≥ 0.10), and ambiguous tiers based on the probability margin Δp = pmax − p2nd. These conservative thresholds ensure that secure assignments require both a high posterior probability and a clear separation from neighbouring families.
Most clusters satisfy the secure criterion. Sagittarius, Sequoia, H99, and in situ clusters are almost entirely secure, reflecting the compact or dynamically distinct loci of these systems. GSE shows the largest fraction of likely or ambiguous assignments, consistent with the expected overlap of early accretion debris in the inner halo. Ambiguous objects — a small minority — occupy transitional phase-space regions where debris from multiple events has mixed. The classification is stable under moderate variations of the feature set and covariance regularisation; differences under perturbation occur almost exclusively among objects already flagged as ambiguous.
We note that the multivariate Gaussian assumption is a deliberate simplification: real tidal debris streams have non-Gaussian distributions in action space, particularly for Sagittarius and Sequoia. However, the strong covariance regularisation and soft priors applied here mean that the classifier effectively acts as a smoothed nearest-neighbour assignment rather than a strict parametric model, and the validation tests above confirm that non-Gaussian features do not substantially degrade classification accuracy for the families relevant to the MP analysis.
A.1 Quantitative validation
We assessed the robustness and physical plausibility of the classification through three complementary tests.
Phase-space coherence. For each family we computed the hypervolume, ![Mathematical equation: $\[V=\sqrt{\operatorname{det}(\Sigma)}\]$](/articles/aa/full_html/2026/05/aa59820-26/aa59820-26-eq64.png) , in standardised (EJ, Lz, L⊥, Jr, [Fe/H]) space (Table A.1). The resulting hierarchy — Sgr ≪ lowE/in situ ≪ H99 ≲ GSE ≲ Seq — reflects physical expectations: Sagittarius is by far the most compact (log10 V = −10.25), more than eight orders of magnitude smaller than the other families, consistent with its origin in a recent, not-yet-phase-mixed accretion event. At the other extreme, Sequoia and GSE show the largest volumes (log10 V = −1.91 and −2.14), consistent with early, massive mergers whose debris has dispersed broadly in action space. The in situ and lowE families occupy intermediate volumes and similar binding energies, but their dynamical proximity likely reflects the restricted phase space accessible to inner-halo debris rather than a common origin: recent work interprets low E as the remnant of an early massive merger now strongly phase-mixed deep in the MW potential (Massari et al. 2026). The large condition number of the Sagittarius covariance matrix further reflects the near-linear, stream-like alignment of its debris; the moderate values for other families indicate well-resolved, more isotropic distributions.
, in standardised (EJ, Lz, L⊥, Jr, [Fe/H]) space (Table A.1). The resulting hierarchy — Sgr ≪ lowE/in situ ≪ H99 ≲ GSE ≲ Seq — reflects physical expectations: Sagittarius is by far the most compact (log10 V = −10.25), more than eight orders of magnitude smaller than the other families, consistent with its origin in a recent, not-yet-phase-mixed accretion event. At the other extreme, Sequoia and GSE show the largest volumes (log10 V = −1.91 and −2.14), consistent with early, massive mergers whose debris has dispersed broadly in action space. The in situ and lowE families occupy intermediate volumes and similar binding energies, but their dynamical proximity likely reflects the restricted phase space accessible to inner-halo debris rather than a common origin: recent work interprets low E as the remnant of an early massive merger now strongly phase-mixed deep in the MW potential (Massari et al. 2026). The large condition number of the Sagittarius covariance matrix further reflects the near-linear, stream-like alignment of its debris; the moderate values for other families indicate well-resolved, more isotropic distributions.
Comparison with literature classifications. Comparison against CARMA (Massari et al. 2019, 2023)4 via a row-normalised confusion matrix shows strong diagonal dominance: Sagittarius and lowE are recovered with perfect consistency; H99 at 86%; GSE at 84% (with limited leakage into H99 and Seq due to known inner-halo overlap); and Sequoia at 83%. Global metrics yield an Adjusted Rand Index (ARI) of 0.595 and a Normalized Mutual Information (NMI) of 0.728; a probability-weighted agreement score of 0.473 confirms that discrepancies are confined to low-confidence transition objects. Agreement with Youakim & Lind (2025) is equally strong: GSE-related subgroups (G2, sg-3/4/5) are recovered at pmax ≳ 0.9; the Sequoia subgroup (G4, sg-8) is cleanly identified; Sagittarius is perfectly separated; and G1 ‘Splash’ clusters map preferentially to our lowE family, consistent with an early heated-population interpretation.
Phase-space hypervolume of each dynamical family in standardised action–energy space.
Inter-family separability. Mahalanobis distances between family centroids confirm the picture above. Sagittarius is strongly isolated (d > 90 from GSE and H99). GSE, H99, and lowE partially overlap (d ≈ 4–5), and the in situ–lowE separation is the smallest in the sample (d ~ 2.7), reflecting their shared inner-halo phase space rather than a common progenitor. Sequoia sits at intermediate separations from GSE and H99 (d ≈ 5–8), consistent with its retrograde but partially overlapping location. The global silhouette score of 0.167 is moderate but physically expected: long-term phase mixing erases sharp boundaries between early accretion structures, so clean separation is not anticipated.
Taken together, these tests confirm that the classification is statistically robust and physically consistent with the known dynamical structure of the MW GC system.
Probabilistic dynamical classification of Galactic GCs.
All Tables
Phase-space hypervolume of each dynamical family in standardised action–energy space.
All Figures
|
Fig. 1 Integrals-of-motion projections for the MW GC sample coloured by our final six-family probabilistic classification. Left: E–Lz plane. Right: E–L⊥. Colours and markers denote the assigned family (see the legend). We define the classification confidence using the maximum posterior probability (pmax) and the probability margin (Δp = pmax − p2nd) between the two most probable classes. Objects are considered secure when pmax ≥ 0.80 and Δp ≥ 0.20, likely when pmax ≥ 0.60 and Δp ≥ 0.10, and ambiguous otherwise. For clarity, cluster names are shown only for the objects with likely or ambiguous classifications (see Table A.1). |
| In the text | |
|
Fig. 2 Box-and-whisker plots showing the distributions of [Fe/H] (top) and [α/Fe] (bottom) for the GCs associated with each progenitor family. |
| In the text | |
|
Fig. 3 AMRs for the final merged progenitor groups. Each panel shows individual GCs (points) with asymmetric age and metallicity uncertainties. Grey-shaded kernel-density contours highlight the main population distribution, and the orthogonal distance regression linear fit (dashed line) accounts for errors in both variables. The linear fits provide a visual diagnostic of the overall AMR trend within each progenitor; however, they should not be interpreted as physical enrichment rates, as the inferred slopes depend sensitively on the sampled age range. |
| In the text | |
|
Fig. 4 Hierarchical Bayesian AMRs for accreted MW progenitors traced by GCs. Left: absolute look-back age versus [Fe/H], with observational uncertainties shown as error bars. Solid lines indicate the posterior median AMR for each progenitor, and shaded regions represent the 68% (dark) and 90% (light) credible intervals derived from posterior samples. Right: same relations expressed in relative time since enrichment onset, Δt = L0 − t, highlighting the inferred enrichment duration prior to truncation. |
| In the text | |
|
Fig. 5 Progenitor stellar masses inferred from the AMR subsample compared to dynamical constraints. Grey-shaded boxes indicate the allowed progenitor stellar-mass ranges inferred from GC orbital information in E-MOSAICS by Pfeffer et al. (2020). Black points show the chemistry-only M⋆ posteriors obtained by inverting the dwarf mass–metallicity relation using the AMR-inferred [Fe/H]stop (error bars are the 16th–84th percentiles from MC propagation). Red points show the corresponding importance-weighted posteriors after applying the Pfeffer et al. (2020) mass constraints as a prior in log M⋆. |
| In the text | |
|
Fig. 6 Residuals of the multiple-population properties δY (top), fP1 (middle), and |
| In the text | |
|
Fig. 7 Predicted values of the linear model evaluated at a common reference point (log Mz = 0, [Fe/H]z = 0) for each progenitor family. Points represent the estimated marginal means, and horizontal bars indicate the 68% confidence intervals derived from the fitted model. After controlling for cluster mass and metallicity, the fraction of first-population stars (fP1) shows systematic differences between progenitors, with Sequoia clusters exhibiting higher fP1 values at fixed mass and metallicity. |
| In the text | |
Current usage metrics show cumulative count of Article Views (full-text article views including HTML views, PDF and ePub downloads, according to the available data) and Abstracts Views on Vision4Press platform.
Data correspond to usage on the plateform after 2015. The current usage metrics is available 48-96 hours after online publication and is updated daily on week days.
Initial download of the metrics may take a while.