Fig. 4
Download original image
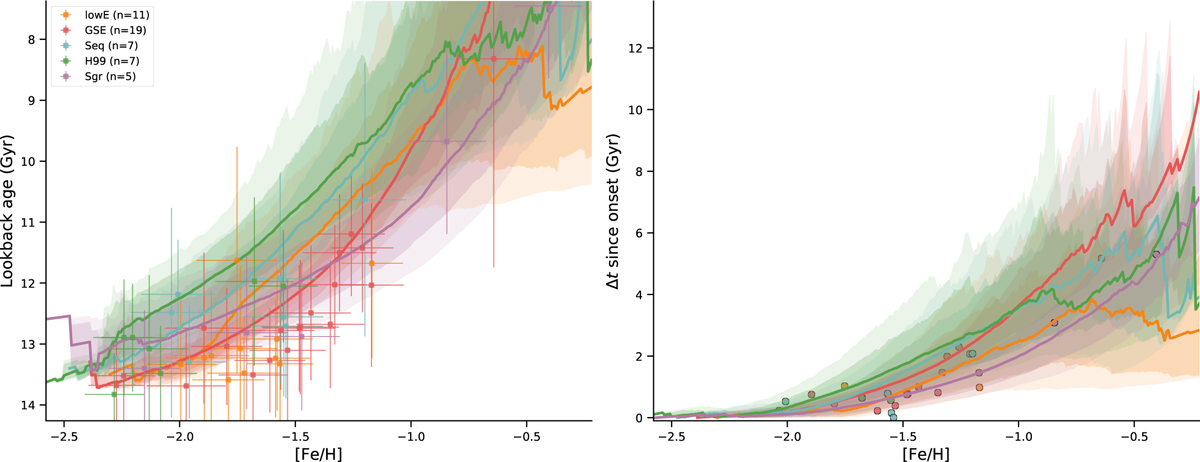
Hierarchical Bayesian AMRs for accreted MW progenitors traced by GCs. Left: absolute look-back age versus [Fe/H], with observational uncertainties shown as error bars. Solid lines indicate the posterior median AMR for each progenitor, and shaded regions represent the 68% (dark) and 90% (light) credible intervals derived from posterior samples. Right: same relations expressed in relative time since enrichment onset, Δt = L0 − t, highlighting the inferred enrichment duration prior to truncation.
Current usage metrics show cumulative count of Article Views (full-text article views including HTML views, PDF and ePub downloads, according to the available data) and Abstracts Views on Vision4Press platform.
Data correspond to usage on the plateform after 2015. The current usage metrics is available 48-96 hours after online publication and is updated daily on week days.
Initial download of the metrics may take a while.