Fig. 7
Download original image
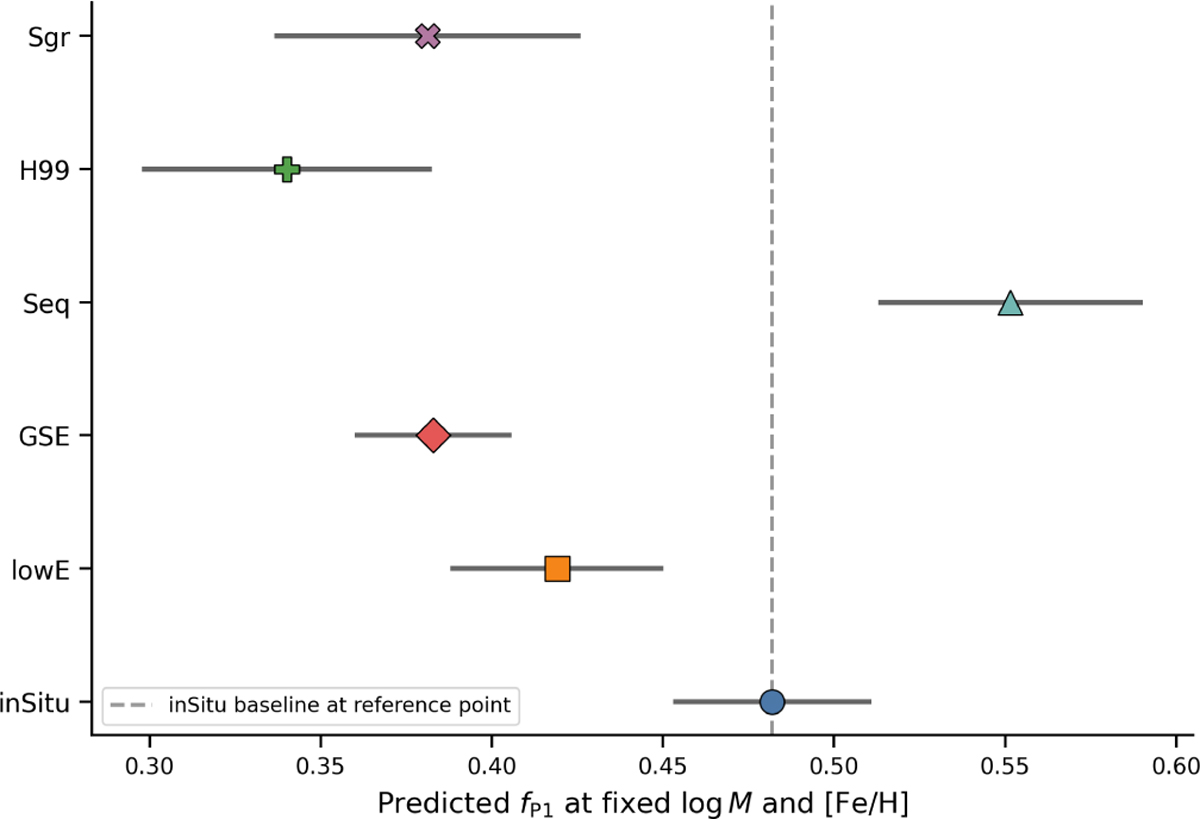
Predicted values of the linear model evaluated at a common reference point (log Mz = 0, [Fe/H]z = 0) for each progenitor family. Points represent the estimated marginal means, and horizontal bars indicate the 68% confidence intervals derived from the fitted model. After controlling for cluster mass and metallicity, the fraction of first-population stars (fP1) shows systematic differences between progenitors, with Sequoia clusters exhibiting higher fP1 values at fixed mass and metallicity.
Current usage metrics show cumulative count of Article Views (full-text article views including HTML views, PDF and ePub downloads, according to the available data) and Abstracts Views on Vision4Press platform.
Data correspond to usage on the plateform after 2015. The current usage metrics is available 48-96 hours after online publication and is updated daily on week days.
Initial download of the metrics may take a while.