| Issue |
A&A
Volume 709, May 2026
|
|
|---|---|---|
| Article Number | C2 | |
| Number of page(s) | 2 | |
| Section | Extragalactic astronomy | |
| DOI | https://doi.org/10.1051/0004-6361/202660483e | |
| Published online | 12 May 2026 | |
Kinematic scaling relations of disc galaxies from ionised gas at z ∼ 1 and their connection with dark matter halos (Corrigendum)
1
Leiden Observatory, Leiden University, P.O. Box 9513, 2300 RA, Leiden, The Netherlands
2
Dipartimento di Fisica e Astronomia, Università degli Studi di Firenze, Via G. Sansone 1, 50019 Sesto Fiorentino, Firenze, Italy
3
Department of Physics and Astronomy, Johns Hopkins University, 3400 N. Charles Street, Baltimore, MD 21218, USA
4
INAF – Padova Astronomical Observatory, Vicolo dell’Osservatorio 5, I-35122 Padova, Italy
5
Sterrenkundig Observatorium, Universiteit Gent, Krijgslaan 281 S9, 9000 Gent, Belgium
★ Corresponding author: This email address is being protected from spambots. You need JavaScript enabled to view it.
Key words: errata, addenda / galaxies: evolution / galaxies: formation / galaxies: fundamental parameters / galaxies: high-redshift / galaxies: kinematics and dynamics
This is a small correction to the top-right panel in Fig. 4 of Mancera Piña et al. (2026). The orange curve, representing the ‘cosmology-only’ evolution hypothesis, is shifted upwards with respect to the local j* − M* relation, while instead it should be shifted downwards, in agreement with Eq. (14) in Mancera Piña et al. (2026). The correct version of the plot is shown in Fig. 1.
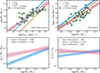 |
Fig. 1. Corrected figure. The only difference compared to Fig. 4 in the original paper is the orange curve in the top-right panel. |
The mistake occurred in the plotting script and did not propagate to any calculations or analyses. Therefore, it does not affect the results or conclusions drawn in the paper. The only sentence that needs an amendment is ‘The evolved TFR and FR are even more discrepant with respect to the observed z = 0.9 relations than those observed at z = 0’. This statement only applies to the TFR (Tully-Fisher relation), not the FR (Fall relation).
References
- Mancera Piña, P. E., Di Teodoro, E. M., Fall, S. M., et al. 2026, A&A, 705, A180 [NASA ADS] [CrossRef] [EDP Sciences] [Google Scholar]
© The Authors 2026
 Open Access article, published by EDP Sciences, under the terms of the Creative Commons Attribution License (https://creativecommons.org/licenses/by/4.0), which permits unrestricted use, distribution, and reproduction in any medium, provided the original work is properly cited.
This article is published in open access under the Subscribe to Open model. This email address is being protected from spambots. You need JavaScript enabled to view it. to support open access publication.
All Figures
|
Fig. 1. Corrected figure. The only difference compared to Fig. 4 in the original paper is the orange curve in the top-right panel. |
| In the text | |
Current usage metrics show cumulative count of Article Views (full-text article views including HTML views, PDF and ePub downloads, according to the available data) and Abstracts Views on Vision4Press platform.
Data correspond to usage on the plateform after 2015. The current usage metrics is available 48-96 hours after online publication and is updated daily on week days.
Initial download of the metrics may take a while.