Fig. 10
Download original image
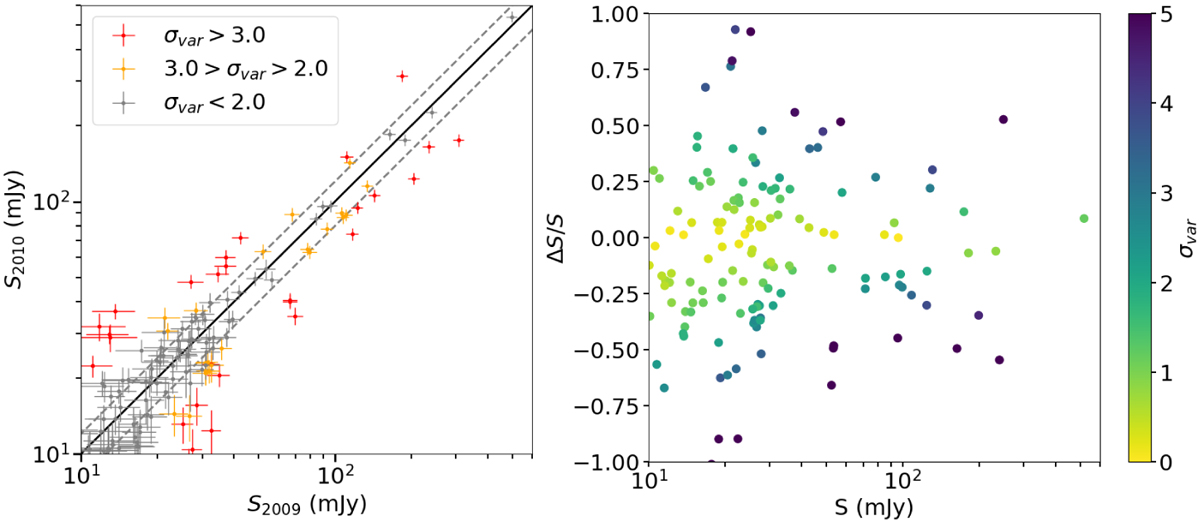
Variability between seasons 3 and 4 at 150 GHz. Left: flux densities from 2009 versus 2010. The straight line marks the 1:1 relation while the dotted lines deviate 20% from it. Red crosses indicate highly variable sources with σvar > 3.0; orange crosses are mildly variable sources with 3.0 > σvar > 2.0; and gray crosses are sources that we consider non-variable. Right: fractional variation of flux density versus the mean flux density; colors represent σvar. Other possible combinations, such as 2008-2010 or 2008-2009, yield similar results.
Current usage metrics show cumulative count of Article Views (full-text article views including HTML views, PDF and ePub downloads, according to the available data) and Abstracts Views on Vision4Press platform.
Data correspond to usage on the plateform after 2015. The current usage metrics is available 48-96 hours after online publication and is updated daily on week days.
Initial download of the metrics may take a while.