Fig. 11
Download original image
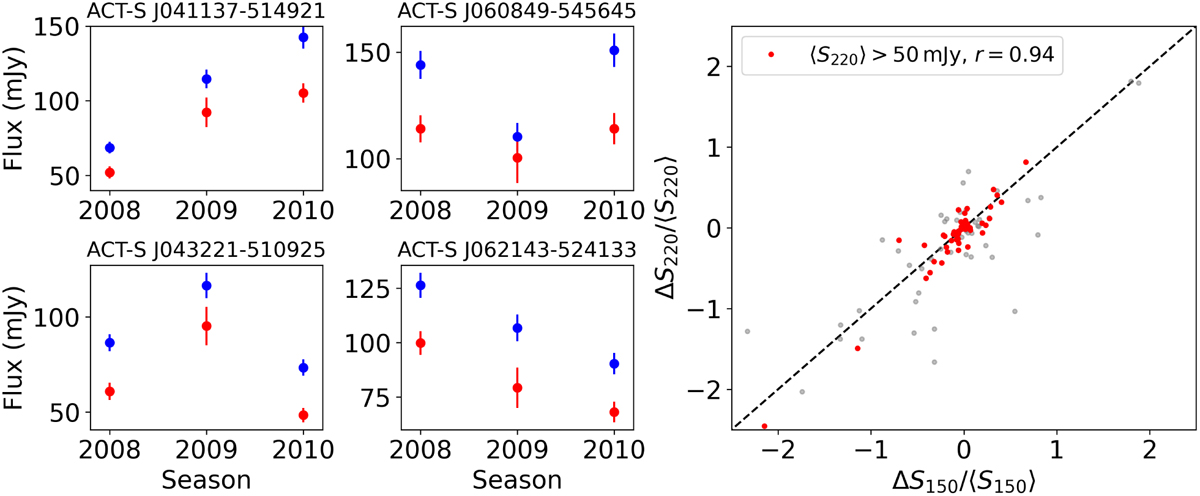
Variability across all seasons at 150 and 220 GHz. Left: flux densities of sources across three seasons, portraying data from f150 in blue and f220 in red. All sources shown are variable and classified as synchrotron emitters. We observe a correlation between frequencies, indicating that changes in flux at f150 correspond to analogous changes at f220. Right: fractional variability for the entire sample from f150 and f220, encompassing all seasons. We highlight sources with a mean f220 flux exceeding 50 mJy in red. The Pearson correlation coefficient for these sources is r = 0.94, while for the entire sample r = 0.84. These findings suggest a significant correlation between frequency bands.
Current usage metrics show cumulative count of Article Views (full-text article views including HTML views, PDF and ePub downloads, according to the available data) and Abstracts Views on Vision4Press platform.
Data correspond to usage on the plateform after 2015. The current usage metrics is available 48-96 hours after online publication and is updated daily on week days.
Initial download of the metrics may take a while.