Fig. D.1
Download original image
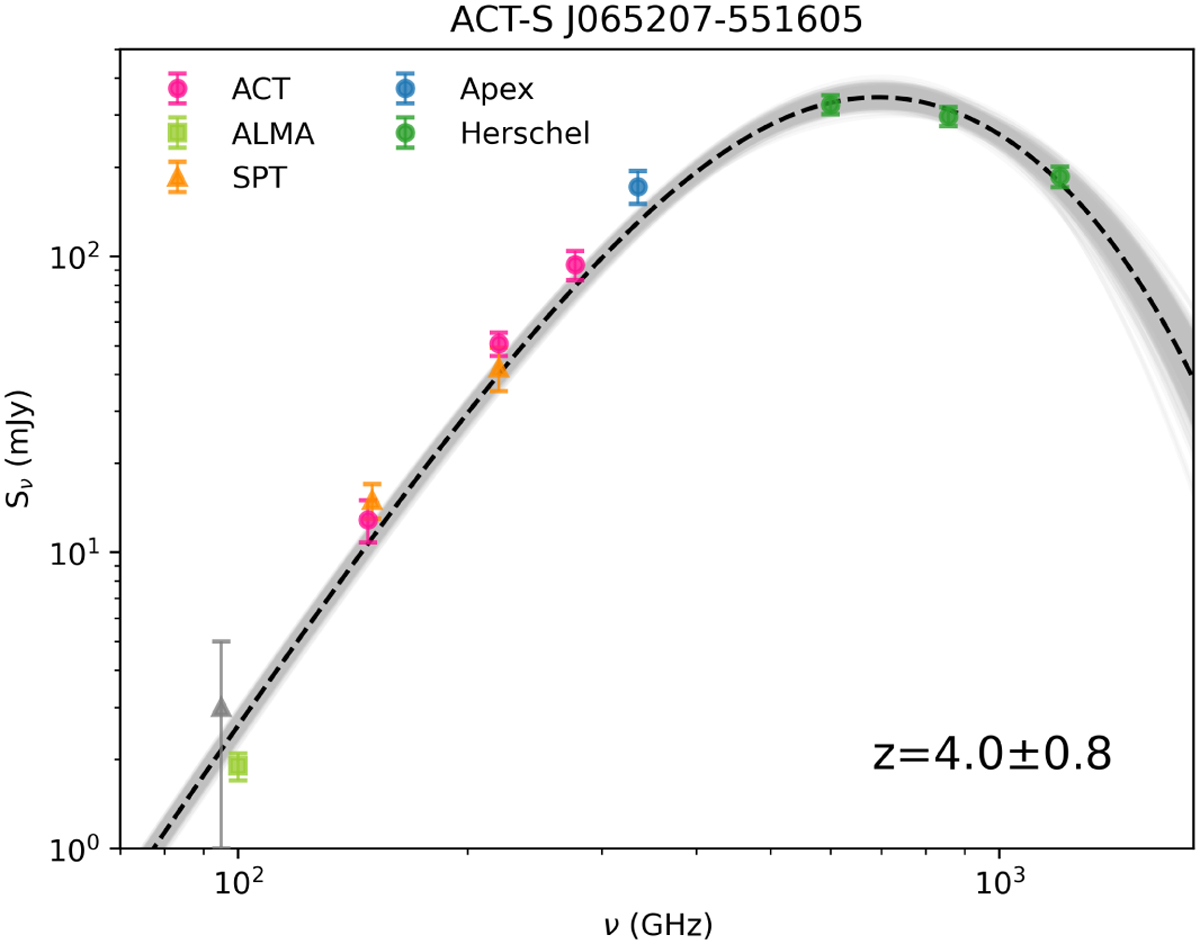
Spectral energy distribution of the high-redshift dusty galaxy ACT-S J065207-551605. The colored measurements identify the ACT (red), SPT (orange), APEX (blue) and Herschel (green) data from Table D.1. The ACT measurements (red dots) correspond to flux densities from the COADD analysis. Grey points identify flux densities with signal to noise ratio lower than 3. The black dashed line corresponds to the modified blackbody function for a single-temperature, while the gray "shadow" is the uncertainty at 1 σ. The obtained photometric redshift z = 4.0 ± 0.8 is presented in the bottom-right corner.
Current usage metrics show cumulative count of Article Views (full-text article views including HTML views, PDF and ePub downloads, according to the available data) and Abstracts Views on Vision4Press platform.
Data correspond to usage on the plateform after 2015. The current usage metrics is available 48-96 hours after online publication and is updated daily on week days.
Initial download of the metrics may take a while.