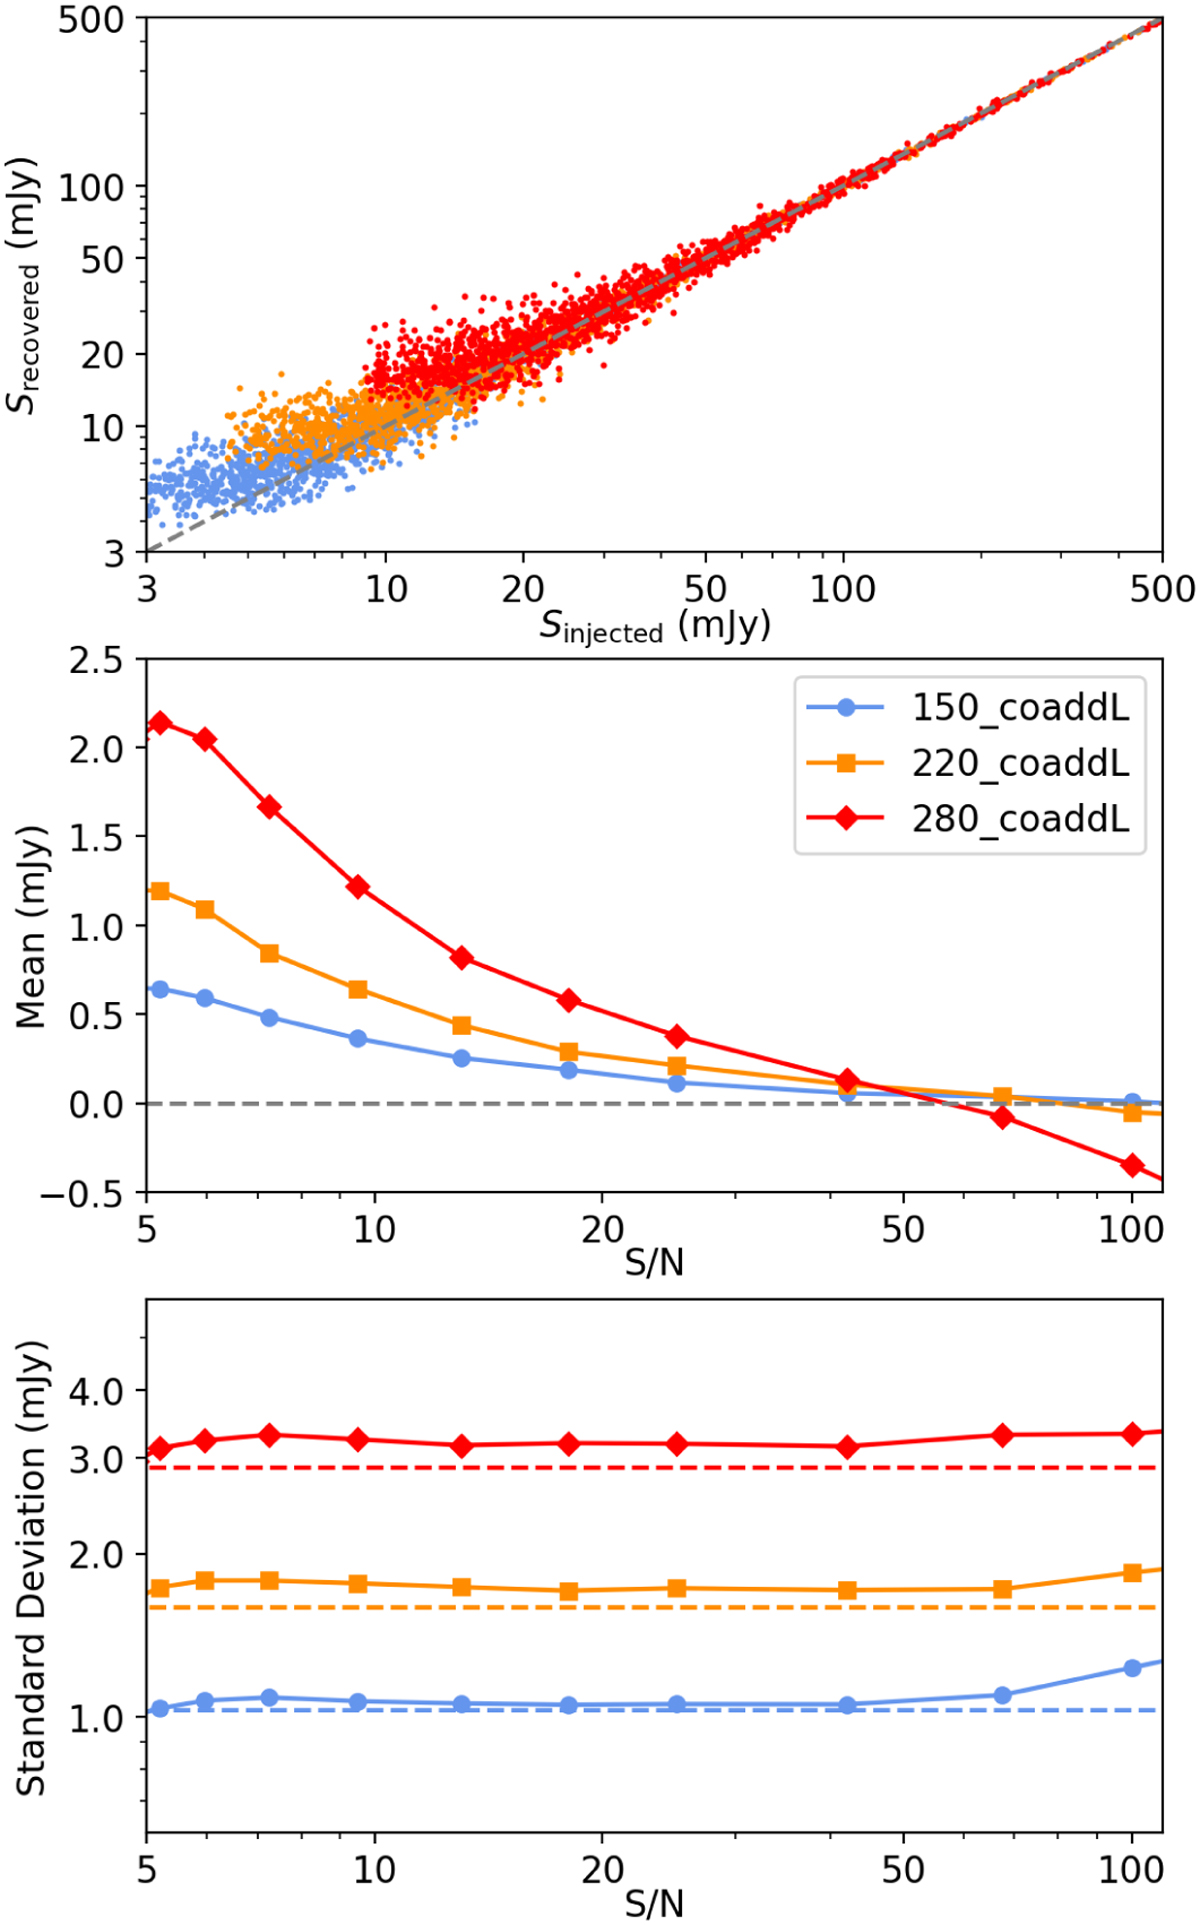
Fig. 4
Download original image
From simulations, statistics of the difference between the flux densities of recovered and injected sources in bins of signal to noise. These results are from the coaddL patch at f150, f220 and f280; other patches show similar results. Top: injected versus recovered fluxes at different frequencies. Middle: mean difference between recovered and injected values across different signal to noise bins. From the mean we see that S/N ≲ 50 sources are boosted in their flux measurements; this boosting is negligible at S/N ≳ 50. Bottom: standard deviation of different bins compared to the measured value from the weighted filtered maps σ0 shown as dotted lines. The S/N ≲ 50 bins agree with a constant model, but the S/N ≳ 50 bins depart from it.
Current usage metrics show cumulative count of Article Views (full-text article views including HTML views, PDF and ePub downloads, according to the available data) and Abstracts Views on Vision4Press platform.
Data correspond to usage on the plateform after 2015. The current usage metrics is available 48-96 hours after online publication and is updated daily on week days.
Initial download of the metrics may take a while.