Fig. 6
Download original image
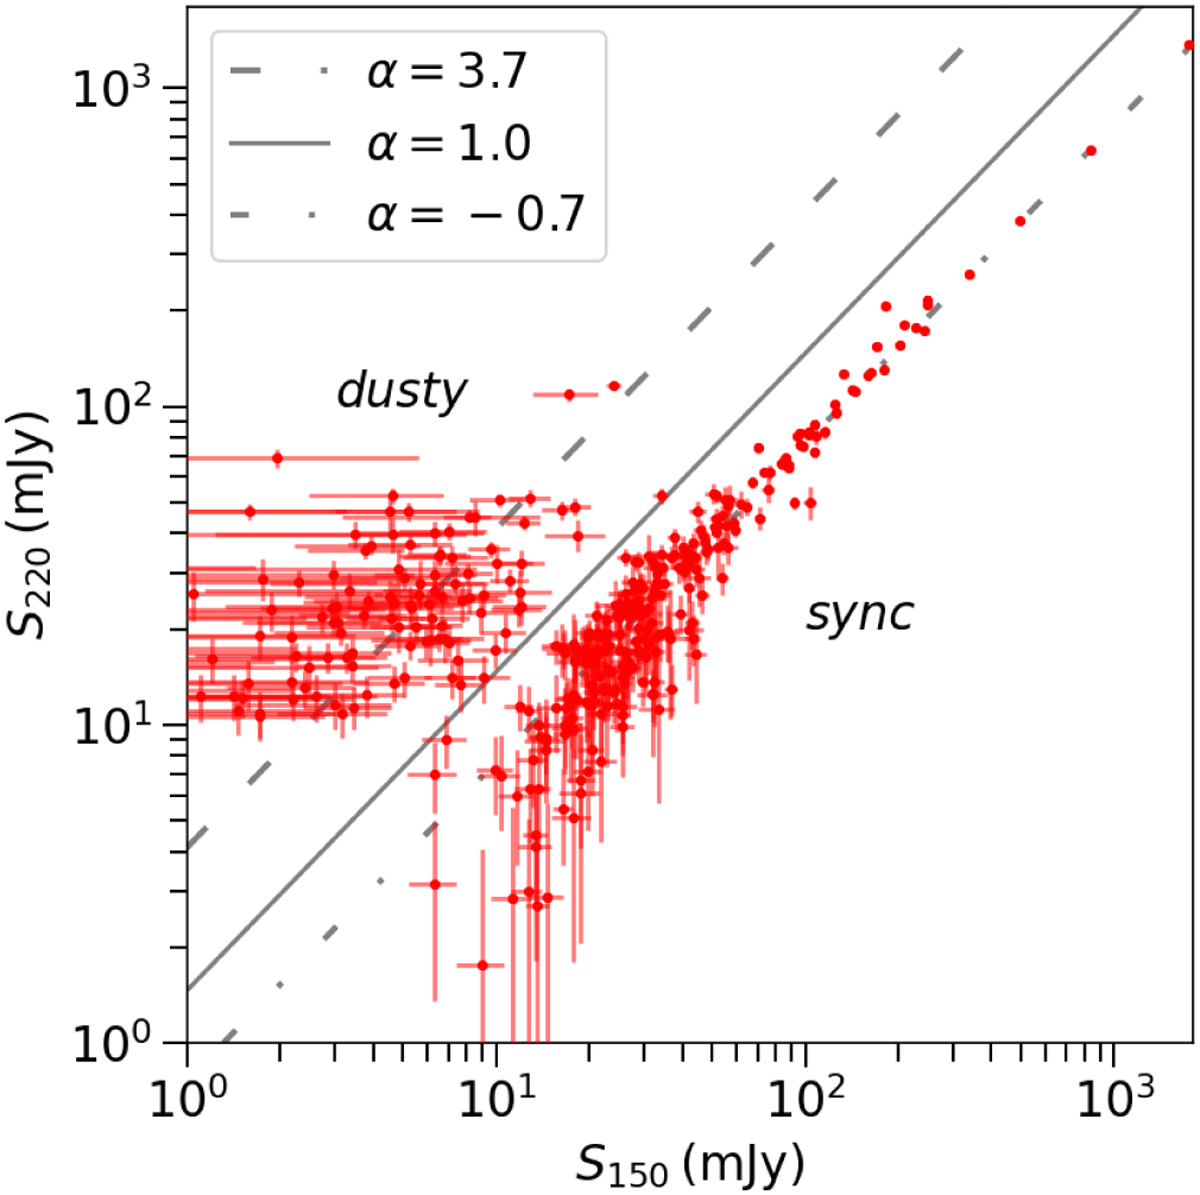
Comparison of f150 flux density against f220 flux density. Sources with at least one detection in either of the two bands are shown as red circles. The population at the right that extends to high flux densities is composed of synchrotron dominated sources; the fainter population to the left, where f220 emission is stronger, is composed of dusty sources. The solid line is an spectral index of 1.3 which is used to separate the populations. The dotted and dashed lines indicate the mean spectral indices of the whole sample for synchrotron and dusty sources of −0.7 and 3.8 respectively.
Current usage metrics show cumulative count of Article Views (full-text article views including HTML views, PDF and ePub downloads, according to the available data) and Abstracts Views on Vision4Press platform.
Data correspond to usage on the plateform after 2015. The current usage metrics is available 48-96 hours after online publication and is updated daily on week days.
Initial download of the metrics may take a while.