Fig. 7
Download original image
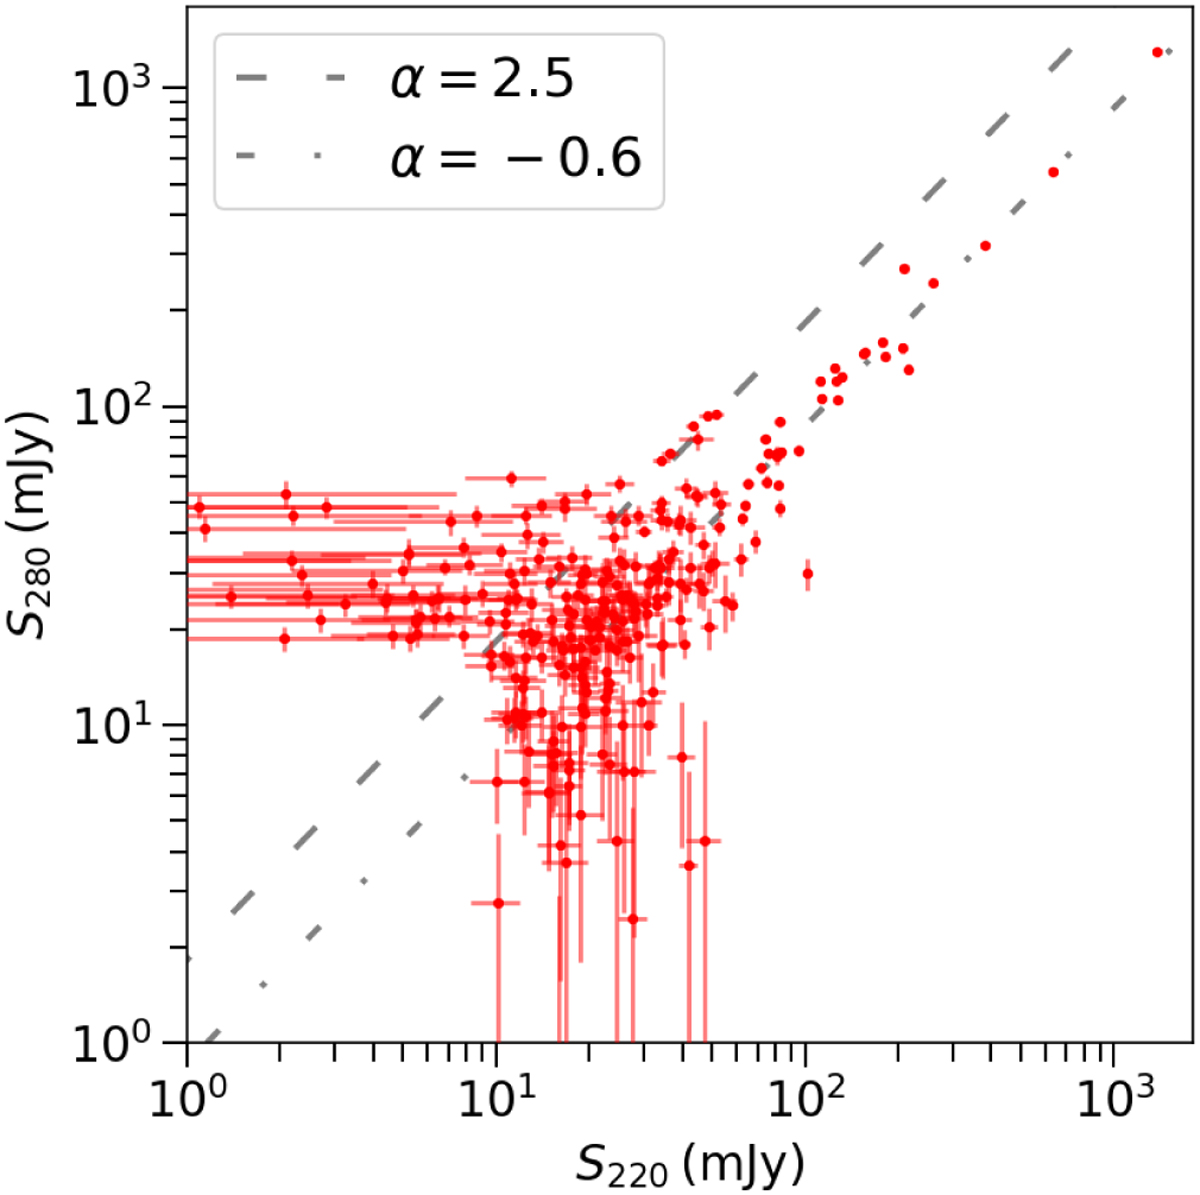
Comparison of f220 flux density against f280 flux density. Sources with at least one detection in either of these two bands are shown as red circles. Here the populations are not clearly separated. The dotted and dashed lines indicate spectral indices of −0.7 and 2.5, which are fits for bright synchrotron and dusty sources. We note that the dusty source spectral index in this case, is lower compared to that between f150 and f220. This indicates a departure from a constant index, suggesting curvature in the spectral energy distribution.
Current usage metrics show cumulative count of Article Views (full-text article views including HTML views, PDF and ePub downloads, according to the available data) and Abstracts Views on Vision4Press platform.
Data correspond to usage on the plateform after 2015. The current usage metrics is available 48-96 hours after online publication and is updated daily on week days.
Initial download of the metrics may take a while.