Fig. 8
Download original image
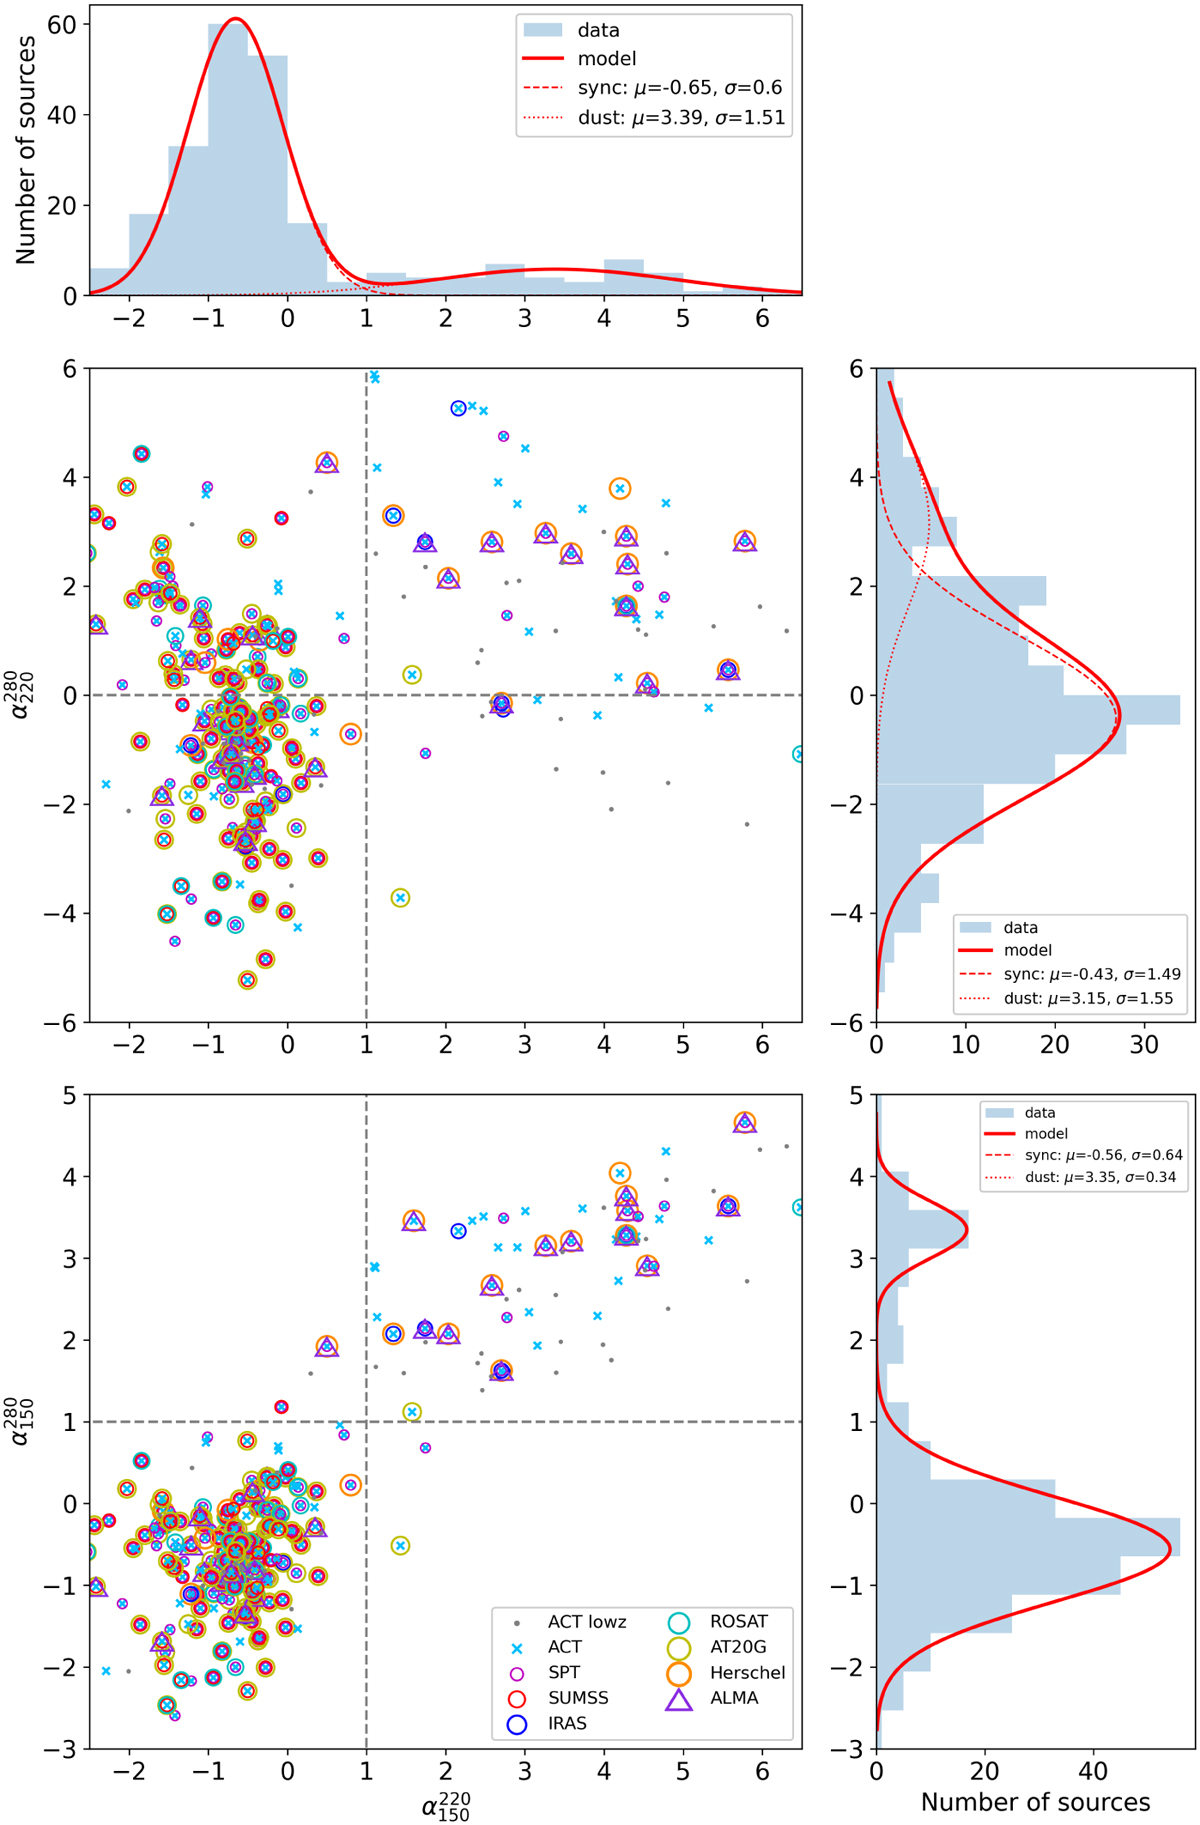
Color-color diagram of sources, including cross-matches and spectral index histograms. Here, we display sources with either (S/N150 > 5, S/N220 > 3 and S/N280 > 1) or (S/N150 > 1, S/N220 > 3 and S/N280 > 5). The populations of synchrotron (at left) and dusty (at right) sources are visibly separated in the 150-220 GHz spectral index. A vertical line at ![]() = 1.0 shows our separation criterion. Counterparts from external catalogs are shown as circles. SPT has detected sources in both populations, and most synchrotron sources have counterparts in SUMSS, AT20G, and ROSAT; dusty sources are more likely to have only counterparts in SPT or IRAS. At top left and bottom right we show the histogram of
= 1.0 shows our separation criterion. Counterparts from external catalogs are shown as circles. SPT has detected sources in both populations, and most synchrotron sources have counterparts in SUMSS, AT20G, and ROSAT; dusty sources are more likely to have only counterparts in SPT or IRAS. At top left and bottom right we show the histogram of ![]() and
and ![]() , respectively. In the case of
, respectively. In the case of ![]() , both populations are clearly separated; we show the double Gaussian fit of separated components and the sum. In the case of
, both populations are clearly separated; we show the double Gaussian fit of separated components and the sum. In the case of ![]() , both populations are not clearly separated, and there is no clear local minima in this case.
, both populations are not clearly separated, and there is no clear local minima in this case.
Current usage metrics show cumulative count of Article Views (full-text article views including HTML views, PDF and ePub downloads, according to the available data) and Abstracts Views on Vision4Press platform.
Data correspond to usage on the plateform after 2015. The current usage metrics is available 48-96 hours after online publication and is updated daily on week days.
Initial download of the metrics may take a while.