Fig. 9
Download original image
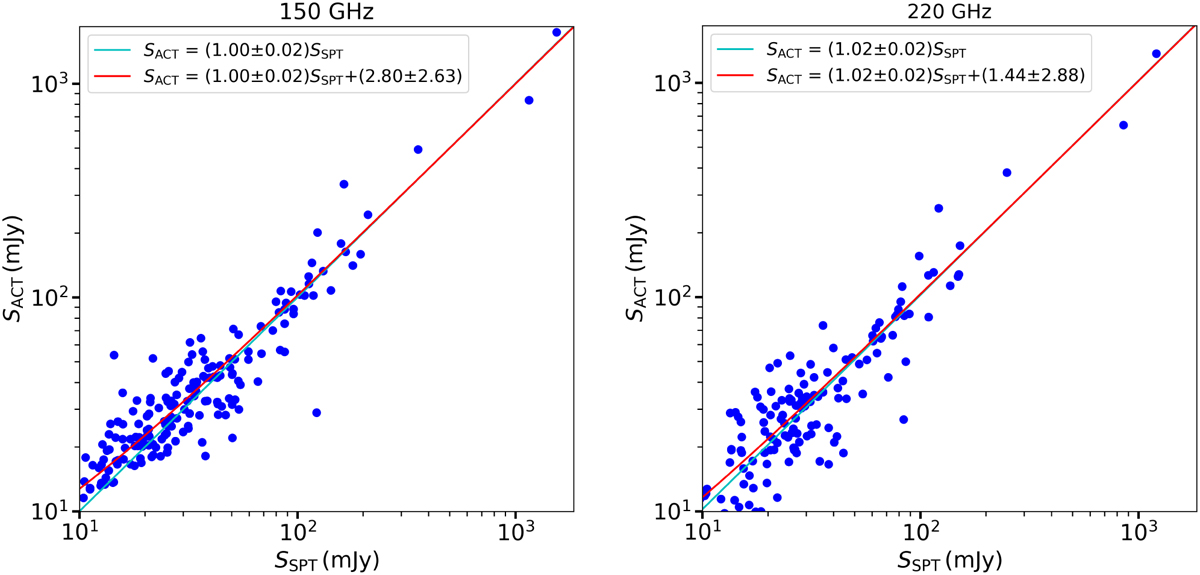
Comparison of ACT and SPT synchrotron source flux measurements at 150 and 220 GHz. Two types of linear fits are shown: a forced fit with a zero intercept (cyan) and a fit with a free intercept (red). The fits show agreement at the percent level within uncertainties, but there is significant scatter for individual sources. This scatter is likely due to flux variability, as it is similar to the level of scatter seen from year-to-year variations (Sect. 5.1).
Current usage metrics show cumulative count of Article Views (full-text article views including HTML views, PDF and ePub downloads, according to the available data) and Abstracts Views on Vision4Press platform.
Data correspond to usage on the plateform after 2015. The current usage metrics is available 48-96 hours after online publication and is updated daily on week days.
Initial download of the metrics may take a while.