Fig. 12
Download original image
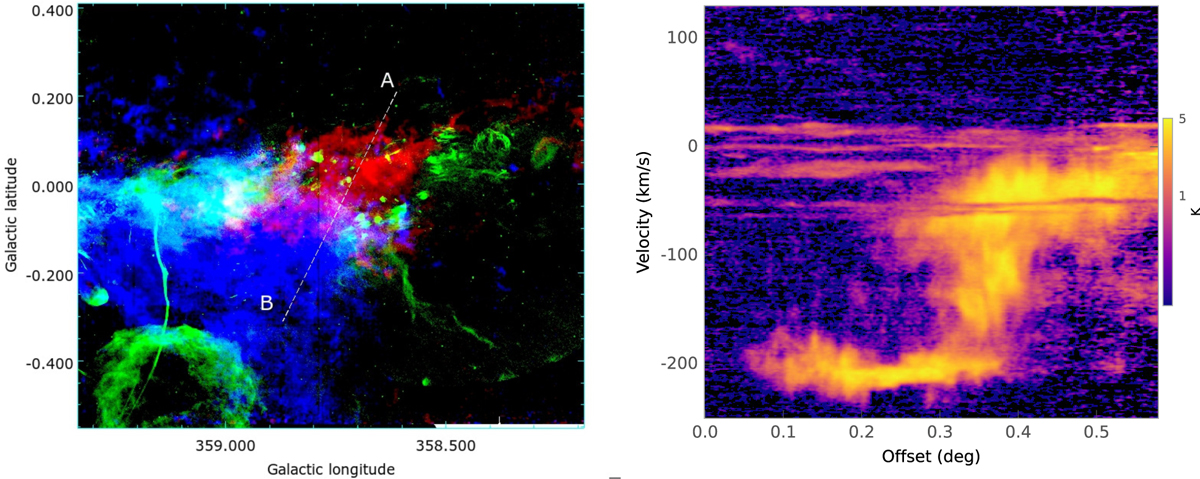
Left: three-color map of the SgrE region. Red shows 12CO(J=3–2) emission integrated over −240 to −190 km s−1, tracing the far dust-lane component; blue shows −185 to −50 km s−1, tracing the main CMZ stream and the emission bridge observed in Fig. 10b; and green corresponds to the MeerKAT 1 GHz image, tracing the H II regions. The dashed line (AB) indicates the cut used to construct the LV diagram. Right: 12CO(J=3–2) LV diagram along the AB line, revealing a velocity bridge linking the far dust-lane gas with the CMZ stream, consistent with a site of cloud-cloud interaction.
Current usage metrics show cumulative count of Article Views (full-text article views including HTML views, PDF and ePub downloads, according to the available data) and Abstracts Views on Vision4Press platform.
Data correspond to usage on the plateform after 2015. The current usage metrics is available 48-96 hours after online publication and is updated daily on week days.
Initial download of the metrics may take a while.