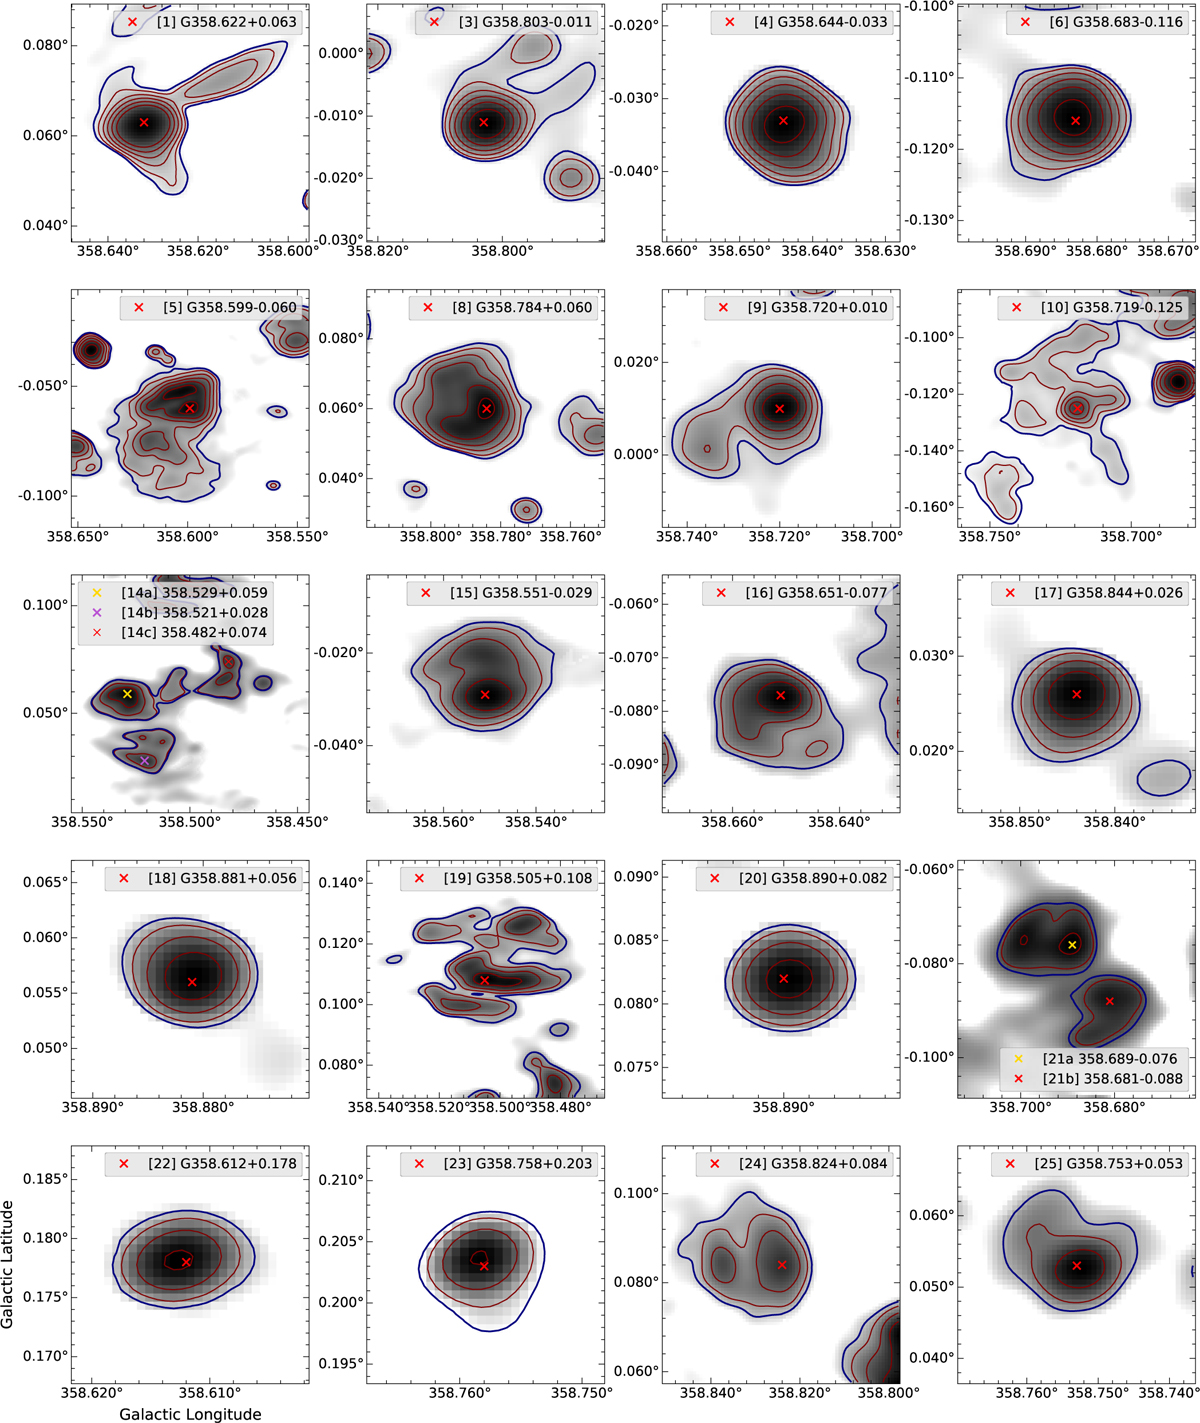
Fig. A.1
Download original image
Morphologies of various H II regions. Each panel displays the source name and ID, along with the peak radio emission marked by cross symbols. The thick navy contours indicate the BLOBCAT regions used for the photometric measurements. They correspond to emission levels of 3 σrms for all sources, except for sources 14 and 21, where the contours correspond to 4.6 σrms and 7.6 σrms, respectively. The maroon contours represent emission levels of 5, 10, 20, 40, and 80 σrms, where the local σrms is obtained from the signal-to-noise ratio map created by BLOBCAT. Source 8 (G358.784+0.060) has a broken shell-like structure. Sources 5 (G358.599–0.060) and 15 (G358.551–0.029) show examples of the cometary morphology of H II regions. Source 19 (G358.505+0.108) is an example of multiple compact regions embedded in cometary-like diffuse gas.
Current usage metrics show cumulative count of Article Views (full-text article views including HTML views, PDF and ePub downloads, according to the available data) and Abstracts Views on Vision4Press platform.
Data correspond to usage on the plateform after 2015. The current usage metrics is available 48-96 hours after online publication and is updated daily on week days.
Initial download of the metrics may take a while.