Fig. 4
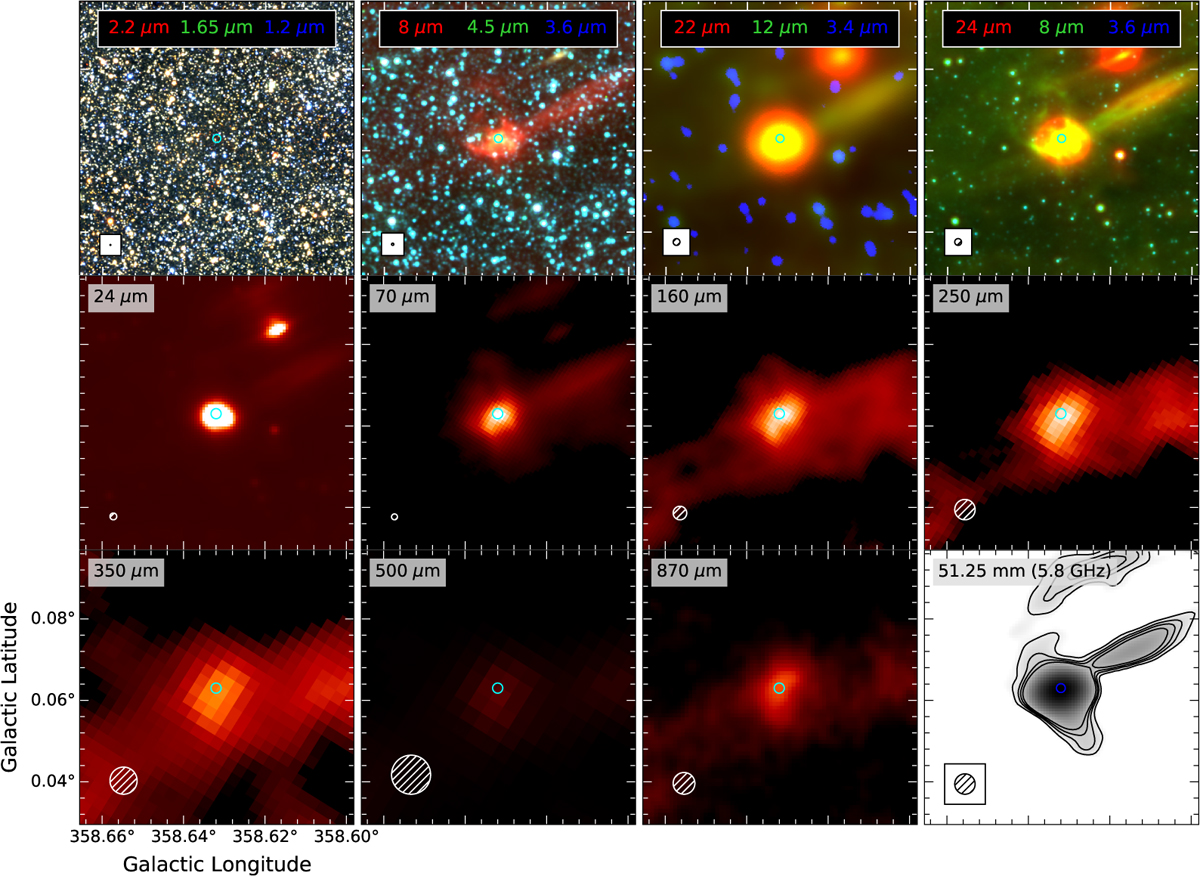
Download original image
Multiwavelength view of the known H II region, G358.632+0.063. First row (from left to right): Color composite images from 2MASS (Skrutskie et al. 2006), GLIMPSE, WISE, and Spitzer. The red, green, and blue colors are shown in each panel. Middle and bottom rows (from left to right and top to bottom): MIPSGAL 24 μm, Hi-GAL 70 μm, Hi-GAL 160 μm, Hi-GAL 250 μm, Hi-GAL 350 μm, Hi-GAL 500 μm, ATLASGAL 870 μm, and 5.8 GHz GLOSTAR VLA-D images of the H II region. The blue circles in the center of each panel show the peak position of radio emission. The FWHM beams of 2MASS (0.8″), GLIMPSE (2″), WISE (6″ at 12 μm), Spitzer (6″ at 24 μm), MIPSGAL (6″ at 24 μm), Hi-GAL (6″, 12″, 18″, 24″, and 35″ at 70, 160, 250, 350, and 500 μm, respectively), and ATLASGAL (19″) are indicated by the black and white circles with hatched lines shown in the lower-left corner of each panel.
Current usage metrics show cumulative count of Article Views (full-text article views including HTML views, PDF and ePub downloads, according to the available data) and Abstracts Views on Vision4Press platform.
Data correspond to usage on the plateform after 2015. The current usage metrics is available 48-96 hours after online publication and is updated daily on week days.
Initial download of the metrics may take a while.