Fig. B.3
Download original image
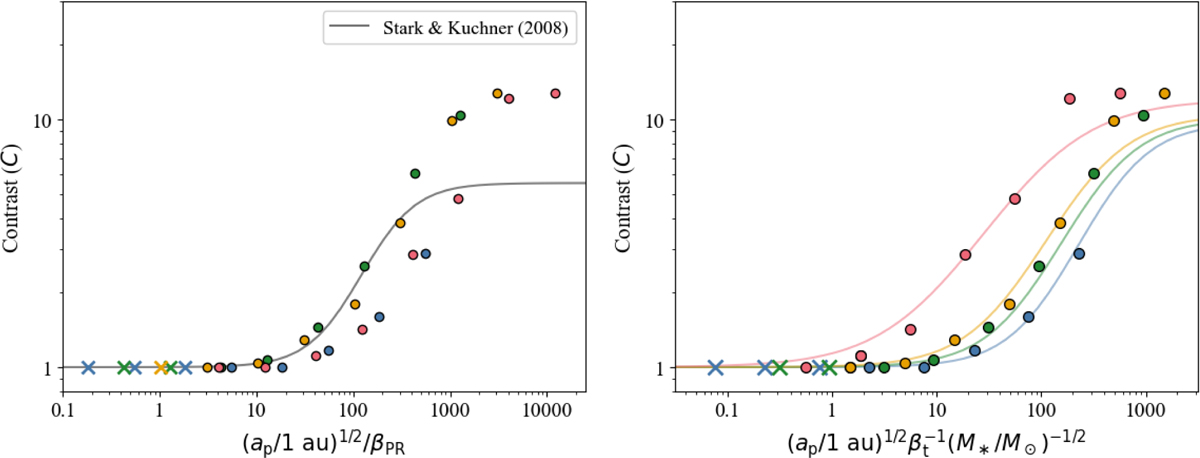
Same data as Fig. 5, but plotted against the original term ![]() from Stark & Kuchner (2008) (left) and the modified term
from Stark & Kuchner (2008) (left) and the modified term ![]() (right). Since βPR is inversely proportional to grain size (Eq. 2) and ap is fixed, higher x-values indicate larger grains. K4 (yellow) and M4 (red) appear to have one fewer point because their 0.3 μm and 1 μm data replace the 0.1 μm points, respectively, causing overlap (see Sect. 2.2.2). See the caption in Fig. 5 for more details on the colors and symbols. A single solid fitted line is shown per spectral type, as only Mp = 1 M⊕ and ap = HZmid was considered in the main study setup.
(right). Since βPR is inversely proportional to grain size (Eq. 2) and ap is fixed, higher x-values indicate larger grains. K4 (yellow) and M4 (red) appear to have one fewer point because their 0.3 μm and 1 μm data replace the 0.1 μm points, respectively, causing overlap (see Sect. 2.2.2). See the caption in Fig. 5 for more details on the colors and symbols. A single solid fitted line is shown per spectral type, as only Mp = 1 M⊕ and ap = HZmid was considered in the main study setup.
Current usage metrics show cumulative count of Article Views (full-text article views including HTML views, PDF and ePub downloads, according to the available data) and Abstracts Views on Vision4Press platform.
Data correspond to usage on the plateform after 2015. The current usage metrics is available 48-96 hours after online publication and is updated daily on week days.
Initial download of the metrics may take a while.