Fig. 4
Download original image
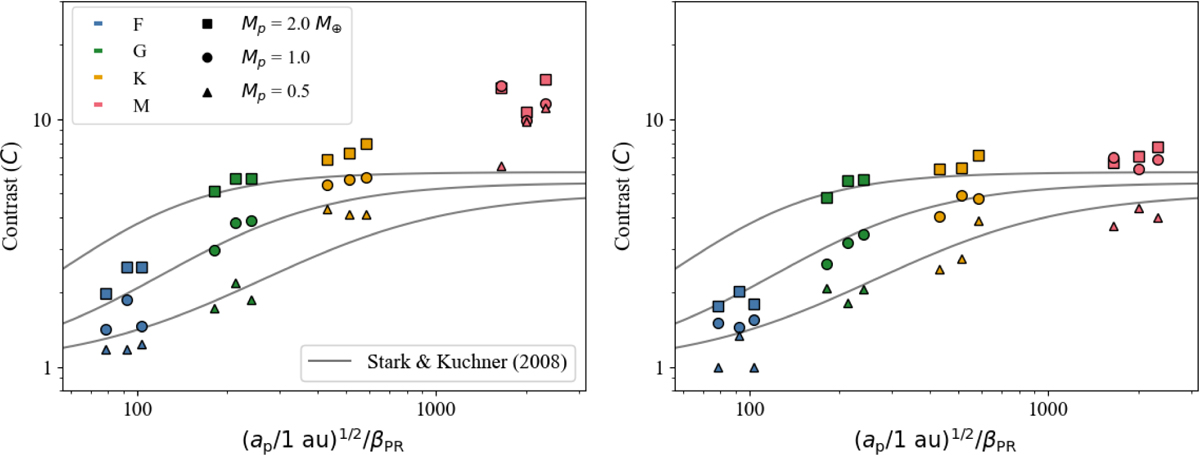
Contrast values from the pilot study, plotted against the ![]() term for Model I (left) and Model II (right). The data corresponding to F4, G4, K4, and M4 are shown in different colors: blue, green, yellow, and red, respectively. Planetary masses of 0.5, 1.0, and 2.0 M⊕ are represented by different shapes, with the solid lines indicating the fits from Stark & Kuchner (2008) for each Mp, increasing from bottom to top. For each color and symbol, the three points from left to right correspond to the planets located at the inner, middle, and outer edges of the HZ. We note that these results are shown for s = 50 μm; the trends do not apply to grains smaller than ∼10 μm around F4, ∼3 μm around G4, and ∼1 μm around K4 and M4-type stars, which are blown out or fail to form resonant rings (see Sect. 3.2.1).
term for Model I (left) and Model II (right). The data corresponding to F4, G4, K4, and M4 are shown in different colors: blue, green, yellow, and red, respectively. Planetary masses of 0.5, 1.0, and 2.0 M⊕ are represented by different shapes, with the solid lines indicating the fits from Stark & Kuchner (2008) for each Mp, increasing from bottom to top. For each color and symbol, the three points from left to right correspond to the planets located at the inner, middle, and outer edges of the HZ. We note that these results are shown for s = 50 μm; the trends do not apply to grains smaller than ∼10 μm around F4, ∼3 μm around G4, and ∼1 μm around K4 and M4-type stars, which are blown out or fail to form resonant rings (see Sect. 3.2.1).
Current usage metrics show cumulative count of Article Views (full-text article views including HTML views, PDF and ePub downloads, according to the available data) and Abstracts Views on Vision4Press platform.
Data correspond to usage on the plateform after 2015. The current usage metrics is available 48-96 hours after online publication and is updated daily on week days.
Initial download of the metrics may take a while.