Fig. 5
Download original image
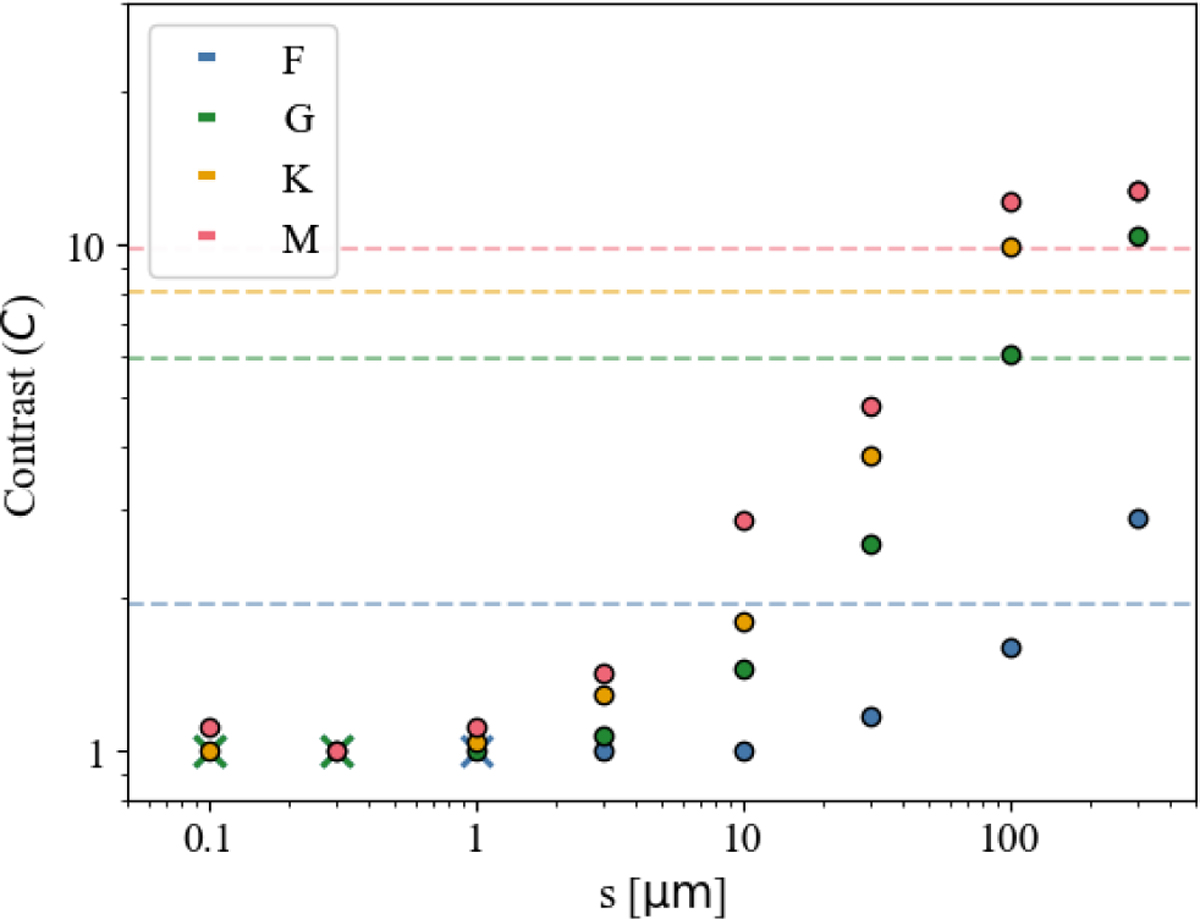
Contrast values from the main study plotted against grain sizes. Cases where s < sBO,eff are shown as cross (×) marks, which overlap with other data points up to 1 μm. The dashed lines indicate the size-combined contrast values of optical depth ![]() ; see Sect. 3.2.2) for each spectral type. The colors and symbols follow those used in Fig. 4. However, only cases with Mp = 1 M⊕ and ap = HZmid are considered here, resulting in eight points for each spectral type. The contrast for 300 μm dust around the K-type star is only slightly lower than that for M-type stars, nearly overlapping and therefore hidden from view.
; see Sect. 3.2.2) for each spectral type. The colors and symbols follow those used in Fig. 4. However, only cases with Mp = 1 M⊕ and ap = HZmid are considered here, resulting in eight points for each spectral type. The contrast for 300 μm dust around the K-type star is only slightly lower than that for M-type stars, nearly overlapping and therefore hidden from view.
Current usage metrics show cumulative count of Article Views (full-text article views including HTML views, PDF and ePub downloads, according to the available data) and Abstracts Views on Vision4Press platform.
Data correspond to usage on the plateform after 2015. The current usage metrics is available 48-96 hours after online publication and is updated daily on week days.
Initial download of the metrics may take a while.